The monorepo vs. multi-repo debate is one of the longest-running arguments in
engineering. Both sides have strong data. Both choices work at scale — Google
runs a monorepo, Amazon runs multi-repo. What the debate usually misses is that
the topology is not the primary variable in CI coordination quality. The observability
layer is. And most teams have one regardless of which topology they chose.
The CI coordination problem: why topology matters less than observability
When teams argue about monorepo vs. multi-repo, they're usually arguing about
the symptoms of an observability problem, not the root cause.
The monorepo team says: "CI takes forever, every change triggers 40 services,
we can't tell which tests are relevant to which change."
The multi-repo team says: "When service A's API changes, service B breaks —
and we don't find out until service B's team runs their CI three days later.
We have no view across all repos."
Both complaints are observability problems. The monorepo team doesn't have
good change-impact analysis. The multi-repo team doesn't have cross-repo
failure correlation. Different symptoms, same underlying gap: there's no
unified layer that makes the CI signal across the entire system legible.
CI Health Score Calculator
Grade your CI, whatever your repo topology
Monorepo or multi-repo, the observability layer is what matters. Deviera scores your pipeline health against DORA benchmarks in about a minute.
Monorepo CI: the three failure patterns that don't appear in single-service pipelines
Monorepo CI introduces coordination challenges that are invisible in smaller
codebases. The three patterns that show up consistently at scale:
1. Blast radius ambiguity.
A developer changes a shared utility function. The CI pipeline runs.
37 services test that function as a dependency. 3 of them fail.
Was the change wrong, or were the 3 failing services already broken before
this commit? In a monorepo without strong change-impact analysis, engineers
spend significant time determining whether a failure is caused by their change
or is a pre-existing condition they've exposed.
The signal you need: per-service failure attribution that distinguishes
"this service failed because of this commit's changes" from "this service was
already failing before this commit."
2. CI runtime growth that kills developer feedback loops.
Monorepos with 50+ services report average CI run times of 23 minutes,
compared to 6 minutes for equivalent single-service pipelines. At 23 minutes,
developers stop waiting for CI before starting the next task. They context-switch.
By the time CI finishes, they're mid-way through a different problem.
The CI feedback loop breaks down not because it fails more often, but because
the latency makes it impractical to stay engaged with it.
The signal you need: affected-service detection that only runs CI
for services actually changed by or dependent on the committed files — not the
full suite for every commit.
3. Shared CI configuration drift.
In a monorepo, multiple teams contribute to the CI configuration. Over time,
inconsistencies accumulate: some services have test coverage gates, others don't.
Some services run integration tests, others only run unit tests. The configuration
becomes a patchwork that individual teams understand only for their own service.
A platform engineer responsible for CI health across all services has no unified
view of whether the configuration is consistent or safe.
The signal you need: CI configuration coverage map showing which services
have which test types, quality gates, and failure thresholds — auditable from a
single view.
Multi-repo CI: the cross-service coordination tax
Multi-repo CI has different problems. Each service is isolated — which is good
for clarity and good for CI run time. It's bad for cross-service correlation.
1. Cross-service failure correlation is manual and delayed.
Service A deploys a breaking API change. Service B starts failing CI.
Service B's team doesn't connect the two events because they're in separate
repositories, separate CI pipelines, and separate Slack channels.
The average time from a cross-service breaking change to its identification
as the root cause of a downstream failure: 2–3 days in multi-repo teams
without shared CI visibility, vs. hours in teams with correlated CI signals.
2. Shared library updates are invisible blast radii.
A shared NPM package is updated. 12 services depend on it.
The library maintainer doesn't know which downstream services will be affected
— they'd have to search each repository's dependency files manually.
Most teams skip this check. They find out which services broke when the
services' own CI runs next.
3. The aggregate CI health signal doesn't exist.
An engineering director overseeing a multi-repo architecture has no native
view of aggregate CI health across all 15 repositories. They're looking at
15 separate CI dashboards or relying on engineers to report failures upward.
The aggregate picture — what percentage of CI runs are passing across all
repos, what the trend is, which repos are outliers — requires either manual
compilation or a tool that aggregates across repositories.
Monorepo CI
Multi-repo CI
Blast radius
Ambiguous — one change tests 37 services; which failures are yours?
Shared-library updates are invisible blast radii
CI runtime
~23 min at 50+ services — feedback loop breaks
~6 min isolated — fast per service
Cross-service failures
Contained in one pipeline
2–3 days to correlate A’s change to B’s failure
Config consistency
Drifts as many teams edit shared CI config
Per-repo, but no shared standard
Aggregate health view
One pipeline, but no per-service rollup
No native view across 15 repos
What actually fixes it
An observability layer over CI signal
An observability layer over CI signal
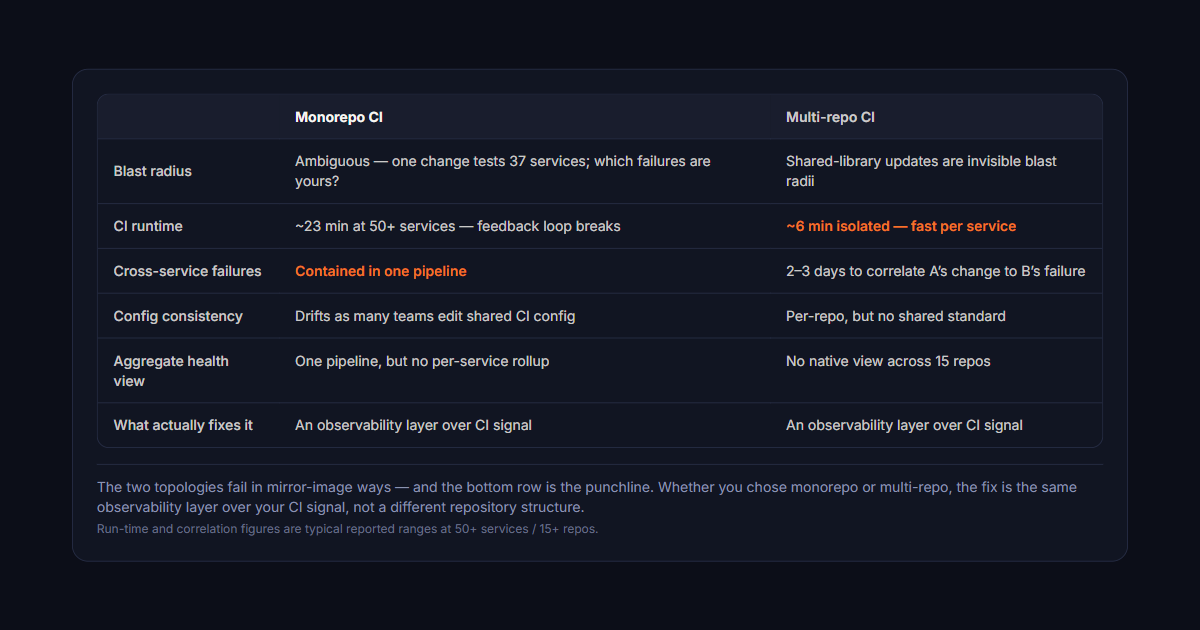
The two topologies fail in mirror-image ways — and the bottom row is the punchline. Whether you chose monorepo or multi-repo, the fix is the same observability layer over your CI signal, not a different repository structure.Run-time and correlation figures are typical reported ranges at 50+ services / 15+ repos.
How to build a unified CI signal regardless of topology
The good news: the observability gap is solvable with the same approach
regardless of whether you chose monorepo or multi-repo. The solution is
an aggregation layer that normalizes CI events from all sources into a
single queryable feed.
What the aggregation layer needs to do:
Collect CI events from all repositories (or all services in a monorepo).
GitHub Actions, CircleCI, GitLab CI, and similar platforms all emit webhook
events on check run completion. A unified aggregation layer subscribes to
all of these and normalizes the events into a consistent schema: service name,
commit SHA, branch, pass/fail, failing test suite, timestamp.
Surface aggregate health metrics, not per-repo status pages.
The signal that matters for an engineering leader is: what percentage of CI
runs are passing across all services in the last 24 hours? Which services
are outliers (failing more than 10% of the time)? Is the aggregate trend
improving or degrading? This requires a rollup view — not a per-repo dashboard.
Enable cross-service correlation for failure investigation.
When service B starts failing, the investigation should start with the question:
"what changed in the last 24 hours in service A or any shared dependency that
service B depends on?" That query requires the aggregation layer to know about
events in both repositories, not just service B's own history.
Route failures to structured tickets with cross-service context.
A CI failure ticket for service B is more useful if it includes: "service A
deployed a breaking change 4 hours ago that service B depends on." That
context assembly requires the aggregation layer to correlate events across
services — which is only possible if the signal is unified.
The repository architecture decision checklist for platform teams
If you're evaluating monorepo vs. multi-repo, the tooling questions matter
as much as the topology questions:
Before choosing monorepo
Do you have or plan to invest in affected-service detection for CI? (Without it, CI run times will grow linearly with the codebase)
Is there a single team responsible for CI configuration consistency across all services?
Do you have tooling for blast radius analysis on shared utility changes?
Before choosing multi-repo
How will you surface aggregate CI health across all repositories to engineering leadership?
How will you detect and route cross-service breaking changes before they cause downstream CI failures?
Is there a unified view for on-call engineers that shows CI failures across all repositories in one place?
For any topology
CI failures should route to structured tickets automatically — not to #dev-alerts channels that may or may not be watched
Aggregate CI pass rate should be tracked weekly as a first-class team health metric
Engineering leadership should see a rollup CI health view, not per-service dashboards
The monorepo vs. multi-repo decision has real architectural implications —
but the CI coordination problems that teams attribute to their topology choice
are almost always observability problems in disguise. The topology defines
where the signal is. The aggregation layer defines whether you can see it.
Teams that invest in the observability layer find that the topology choice
matters less than they expected — because both patterns are manageable when
you can see what's happening across the whole system.
Neither is better in general; they fail differently and you should pick the failure you are equipped to handle. Monorepos concentrate the pain into pipeline duration and blast radius — one bad commit can block everyone, and build times grow with the whole repository unless you invest in affected-target detection. Multi-repo distributes that risk but adds a coordination tax: a change spanning three services means three pull requests, three pipelines, and no single place showing whether the overall change is green.
What CI problems appear in a monorepo that don't exist elsewhere?
Three mainly. Pipeline duration scaling with repository size rather than with the change, which is fixable only with dependency-aware build selection. Blast radius, where one broken commit on the shared main branch blocks every team at once. And test selection, where running everything is safe but slow while running a subset is fast but requires a dependency graph you have to maintain and trust.
How do you get a unified CI view across many repositories?
Aggregate the events rather than the dashboards. Every CI provider emits webhooks for run completion; collecting those into one store gives you cross-repository pass rate, failure trends, and a single answer to whether anything is broken right now. The alternative — opening each repository's CI tab in turn — does not scale past about five repositories, which is precisely when the question becomes hardest to answer.
Should you migrate from multi-repo to a monorepo to fix CI pain?
Rarely, because a migration is expensive and the pain usually comes from missing observability rather than from topology. If you cannot currently tell which service broke a release, moving all the code into one repository does not tell you either — it just makes the failure louder. Fix the visibility first; if the coordination cost is still dominant afterwards, you will at least have the data to justify the migration.