How to Improve Your DORA Metrics: A 4-Week Roadmap
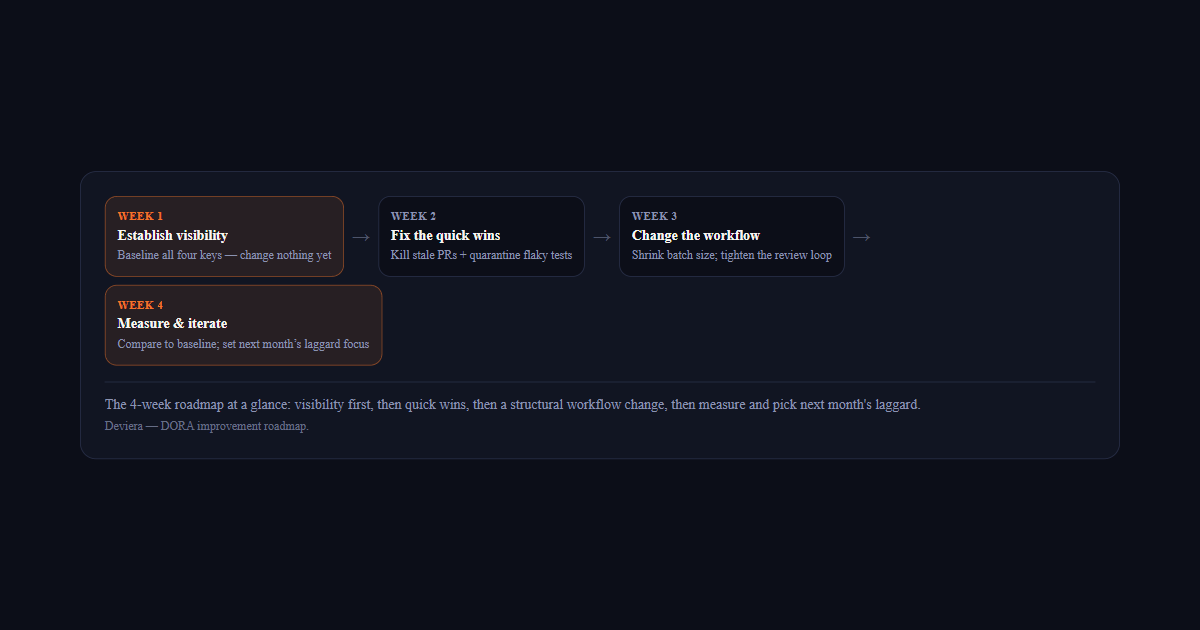
Most teams know their DORA metrics are mediocre but have no plan to fix them. A concrete, week-by-week roadmap that moves all four keys.
Practical guides, research-backed strategies, and real-world examples for engineering teams building faster and more reliably.

Most teams know their DORA metrics are mediocre but have no plan to fix them. A concrete, week-by-week roadmap that moves all four keys.

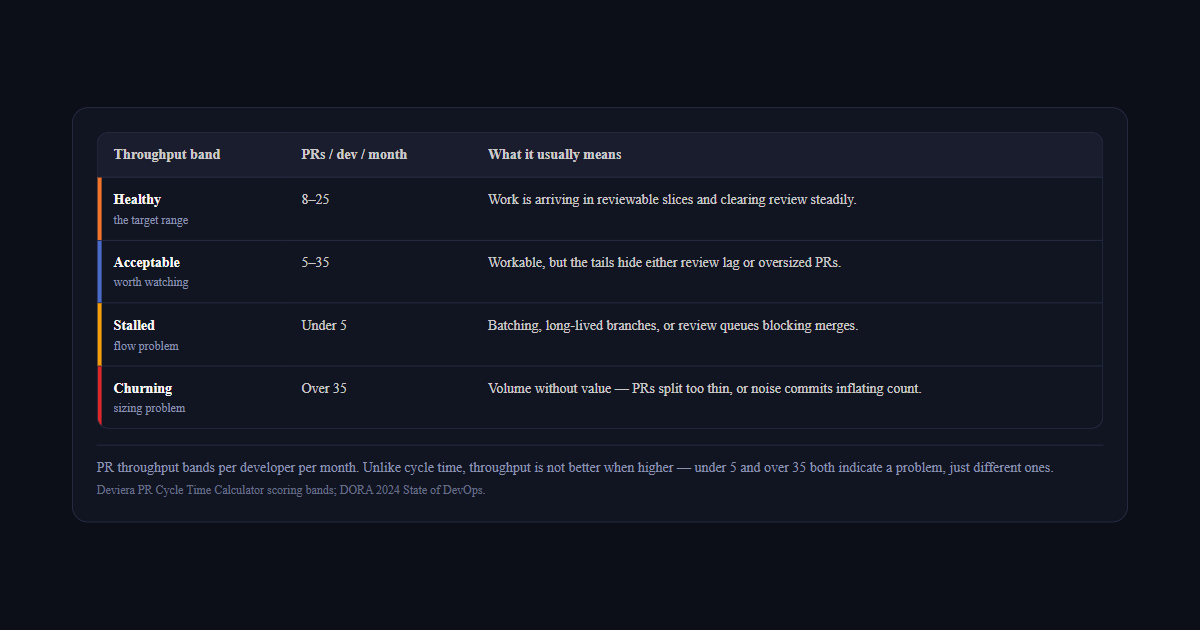
Healthy PR throughput is 8–25 merged PRs per developer per month. Why both ends of that range are warnings, and how to raise it without losing review depth.

Most CI/CD advice stops at 'write tests and automate deploys'. These seven practices are the ones that actually move your DORA metrics.

Code review is where most teams quietly lose days of lead time. These five practices keep reviews fast and high-signal without rubber-stamping.

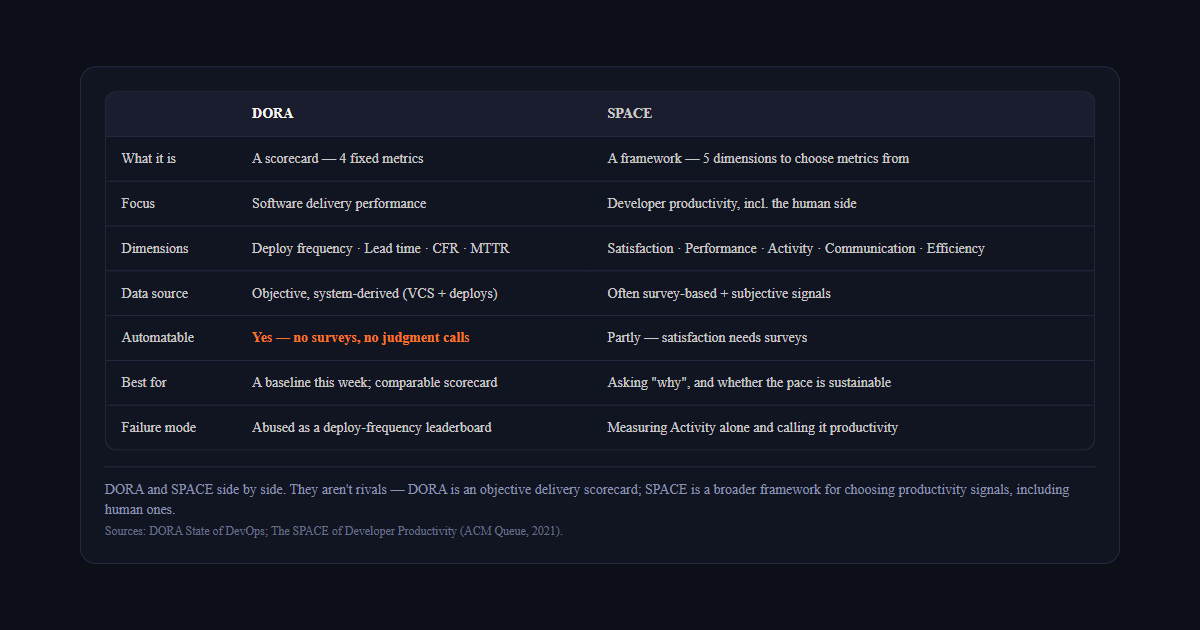
DORA and SPACE are the two leading frameworks for measuring engineering performance — and they're not competitors. What each measures and why to use both.

DORA's four keys are the right baseline, but they don't tell you why a team is struggling. These six health metrics surface the day-to-day friction DORA misses.

Cycle time, lead time, and PR cycle time get used interchangeably — and shouldn't be. What each measures, when each matters, and how to track them.
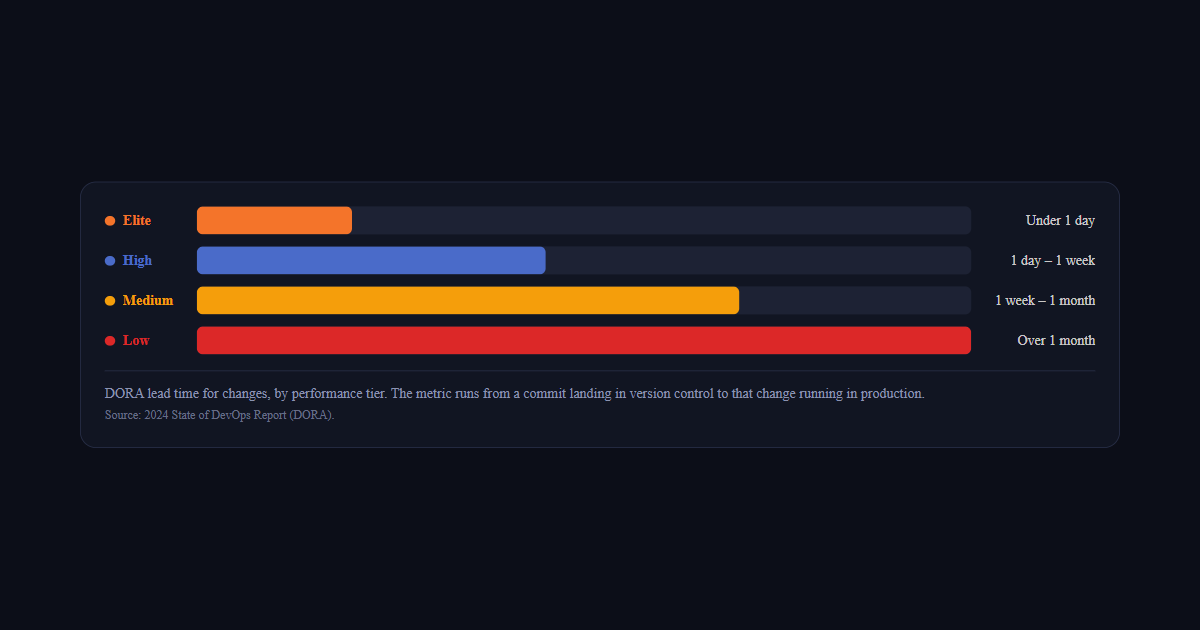
Lead time for changes is the DORA metric measuring how long a commit takes to reach production. How it's defined, what good looks like, and how to move it.

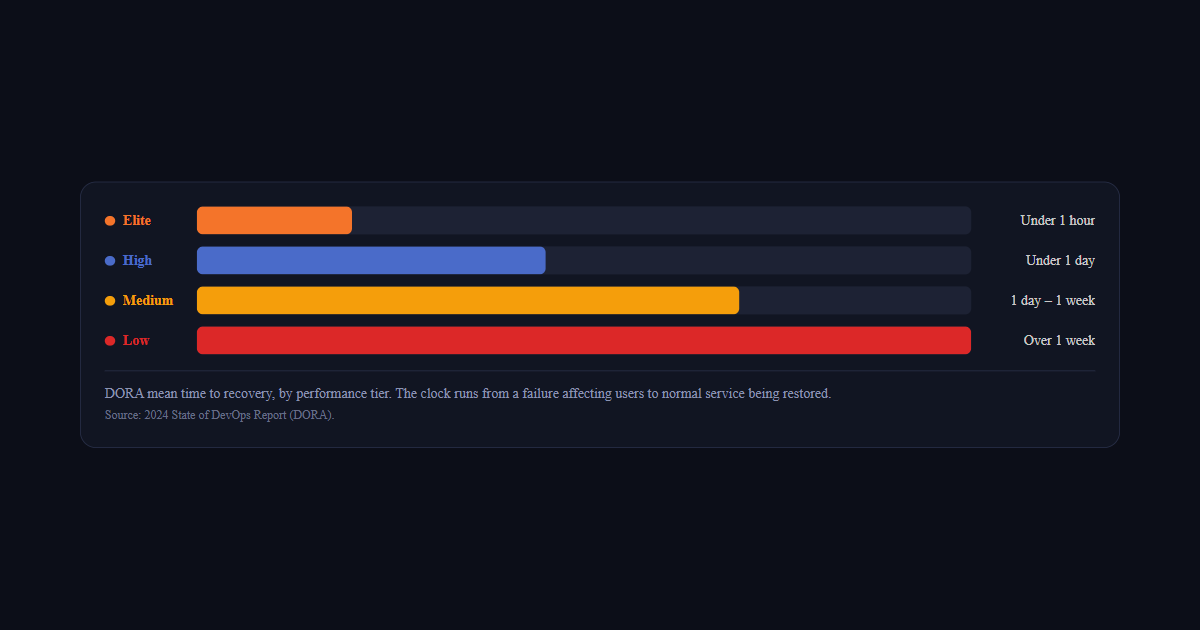
MTTR measures how long it takes to recover after a production failure — the DORA stability metric. Here's how to define, measure, and shorten it.

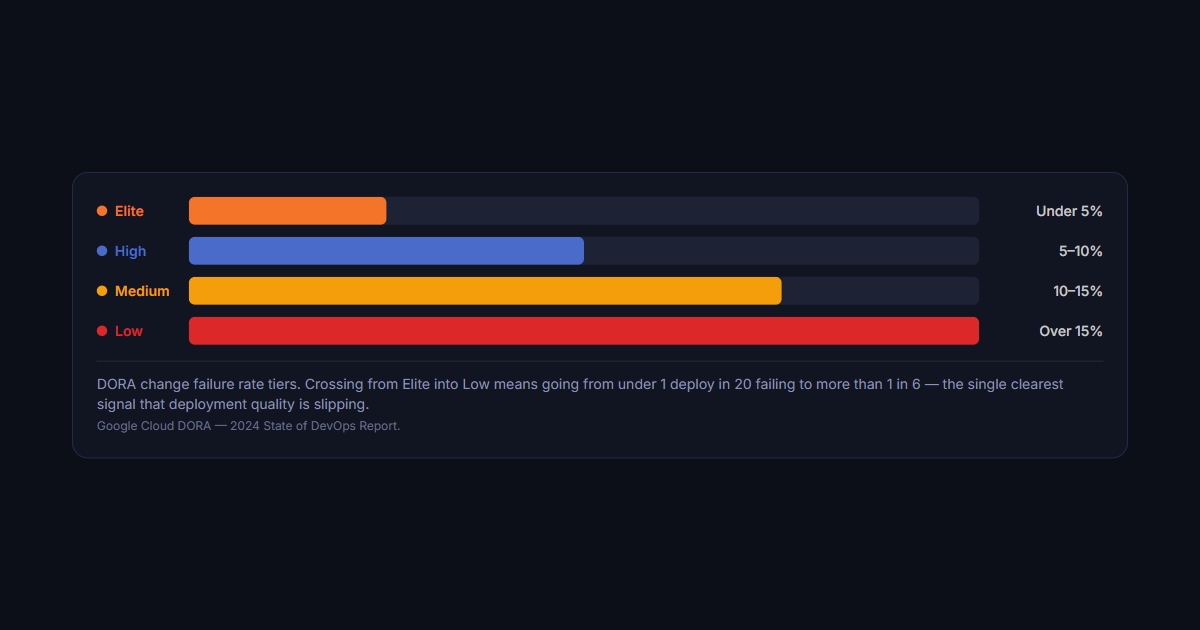
A change failure rate above 15% means one in six deployments breaks production. How elite teams keep CFR below 5% — and how to close the gap in your pipeline.

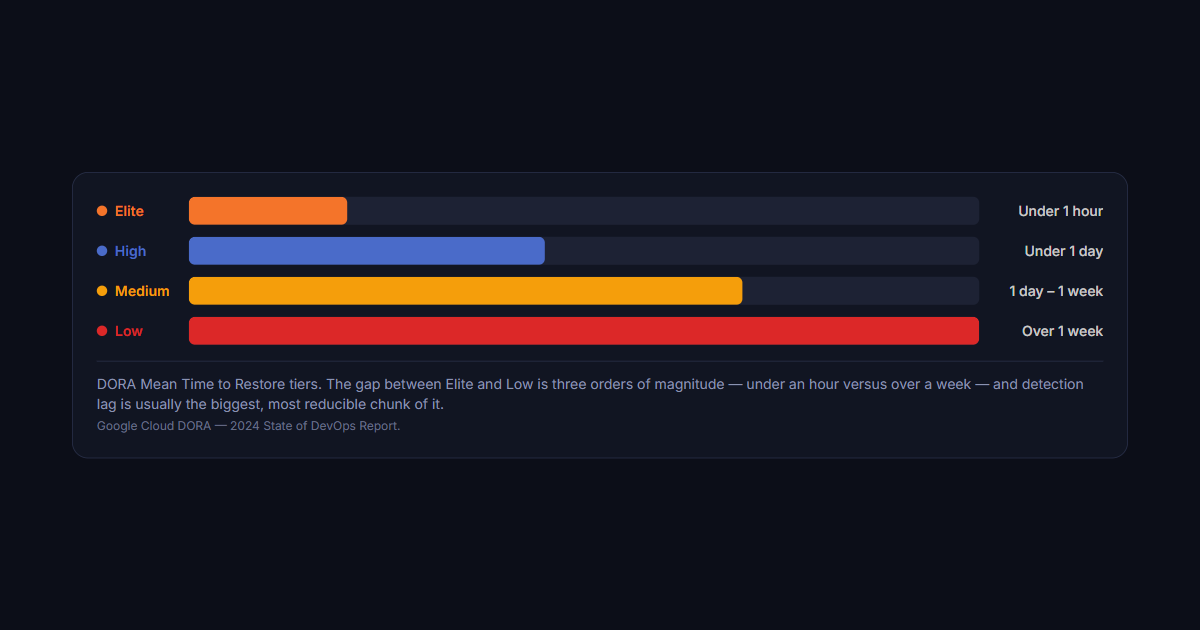
Elite DORA teams restore service in under an hour; low performers take a week. The gap is five specific incident response practices. Here's how to close it.

Jellyfish costs $12,000+/year with a 50-seat minimum. The 7 best Jellyfish alternatives in 2026, compared by use case, automation depth, and pricing.

73% of teams run postmortems, but fewer than 30% track whether action items get completed. The template isn't the problem — the follow-through is.
A deploy fails at 11pm, gets fixed with no ticket, no root cause, no retrospective. Then it recurs. Here's why untracked CI/CD failures are an anti-pattern.

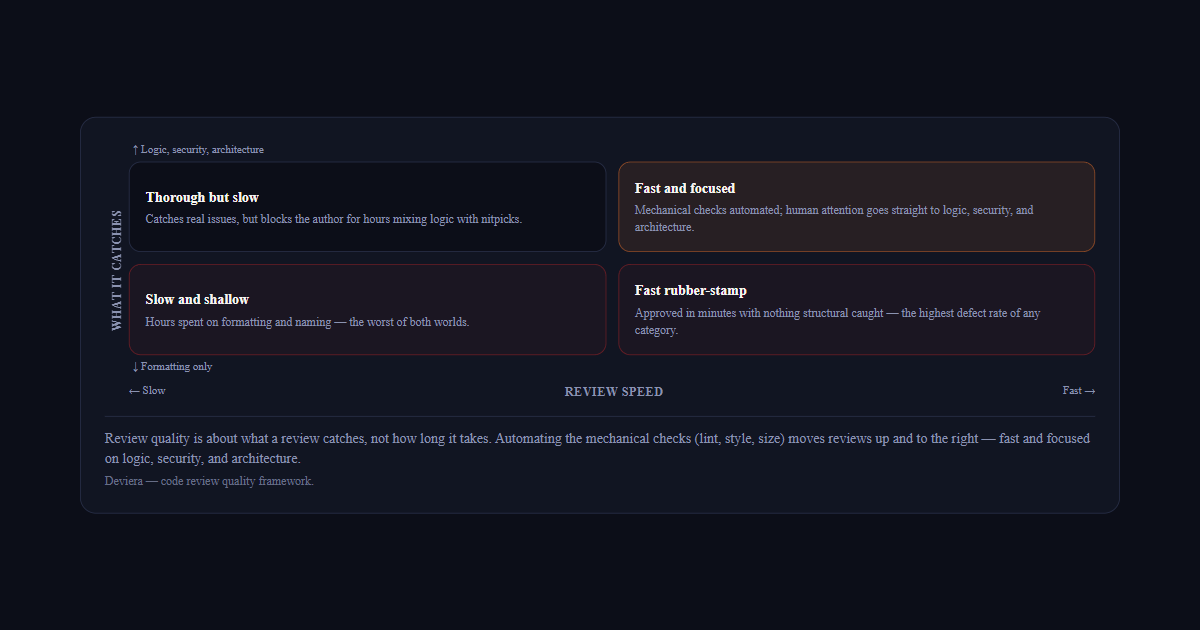
90% of bugs caught in code review could have been caught before submission. Most review time is spent on the wrong things. Here's how to make reviews faster.

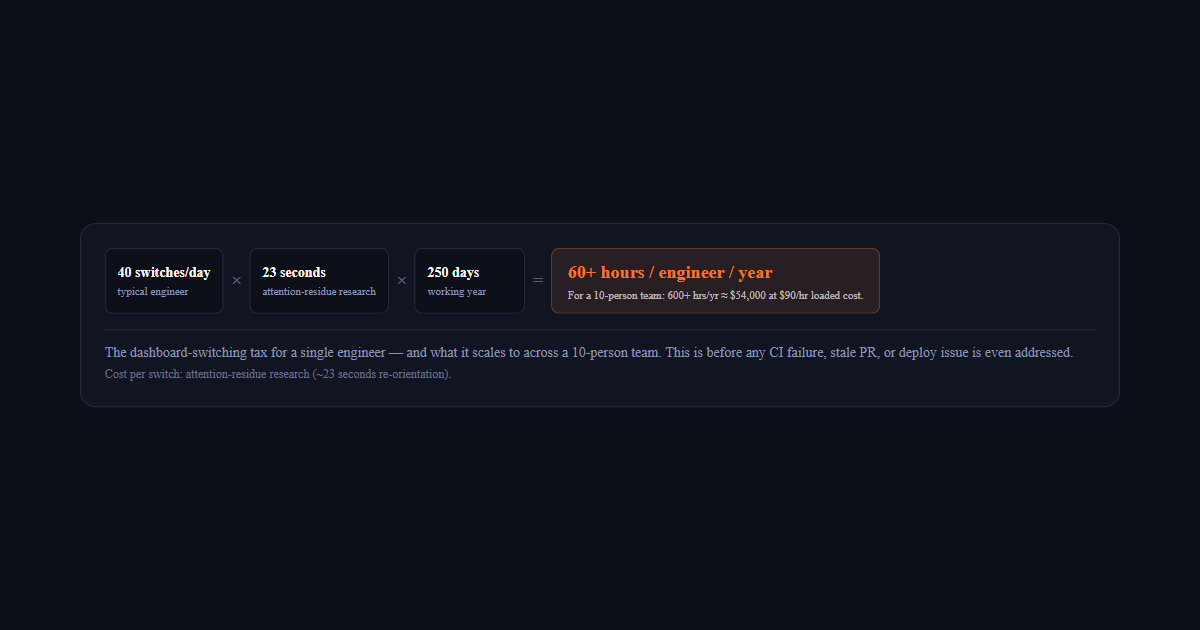
The average engineer switches between 6+ dashboards daily — GitHub, CI, Jira, Slack, Vercel, Linear. That's 60 hours per engineer per year. Here's the math.

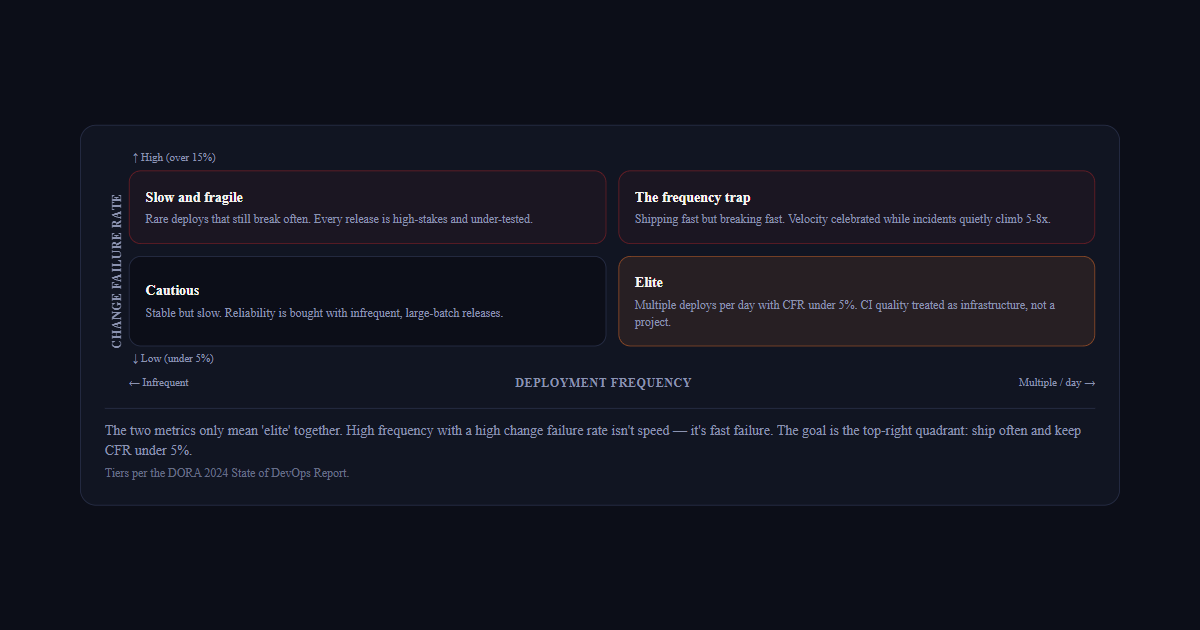
DORA elite teams deploy frequently and keep failure rates low. Many chased frequency and watched CFR climb to 18–22%. Here's how to track both.

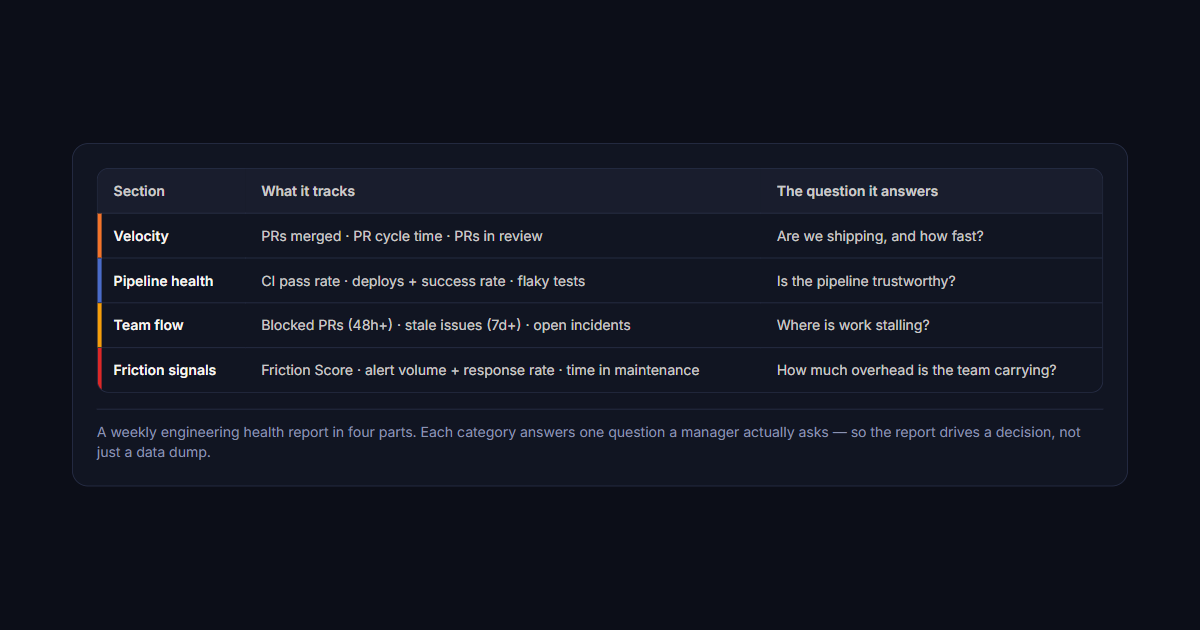
Most health metrics are too lagging (quarterly OKRs) or too noisy (dashboards nobody reads). A weekly cadence hits the sweet spot. Here's what to include.

I was spending 90 minutes every Sunday preparing for standup — checking GitHub, Jira, Vercel, and Slack manually. Here's the automation that replaced it.

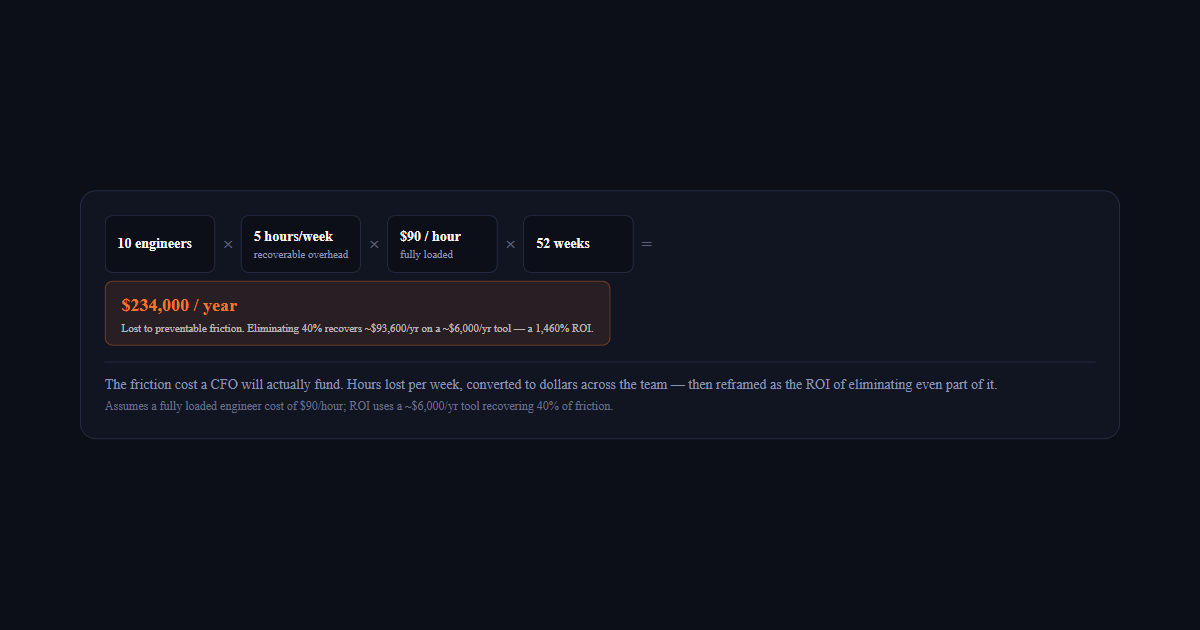
CFOs don't fund vague velocity claims — they fund spreadsheets with numbers. How to quantify what bad tooling costs and what removing that friction saves.

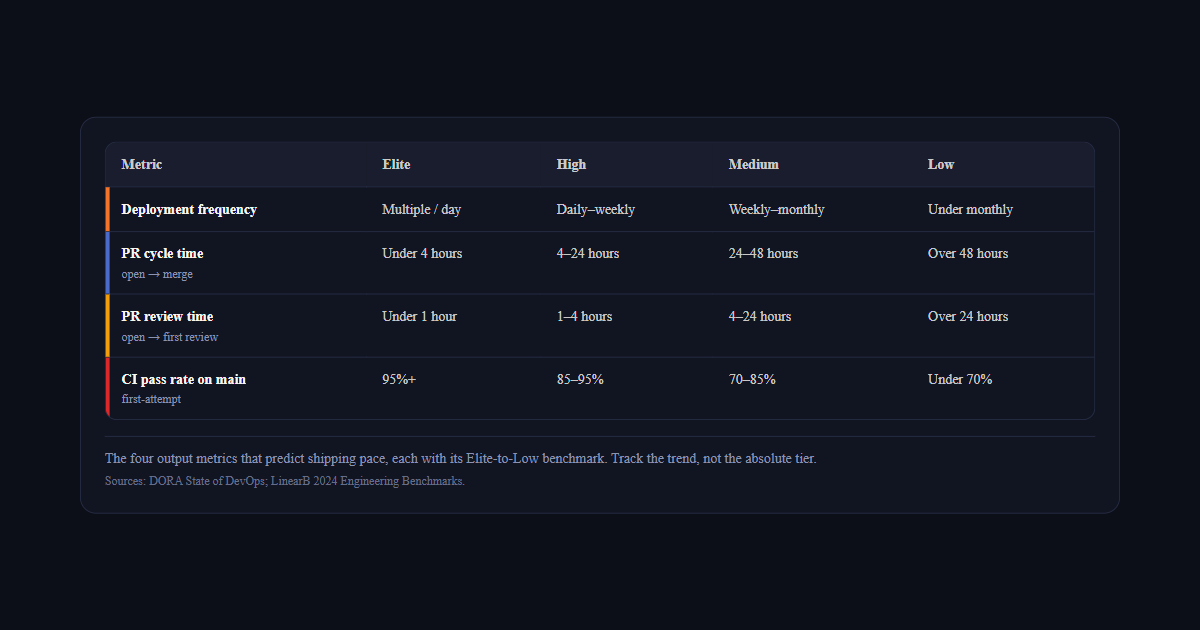
Engineering velocity is how fast work reaches production, not story points completed. Four metrics that reveal your real shipping pace — and how to fix each.

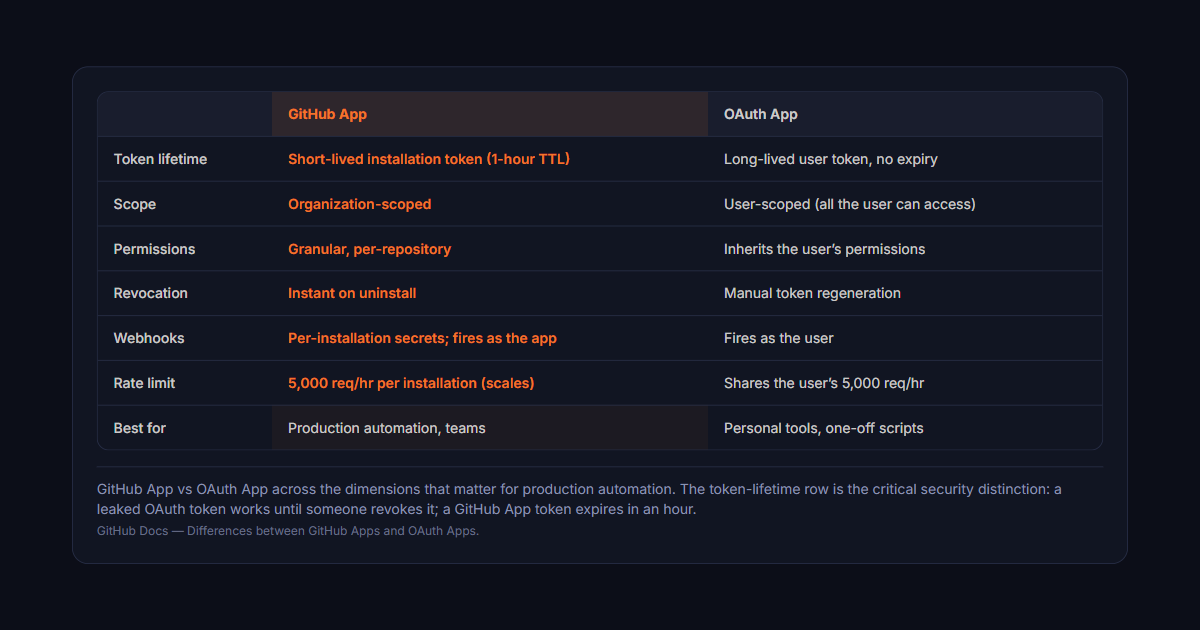
GitHub OAuth apps use user-tied tokens; GitHub Apps use installation tokens with granular, org-scoped permissions. Which to pick, and how the scopes differ.

ClickUp GitHub integration cuts hours of manual syncing every week. The automation patterns that keep pull requests, tasks, and CI failures in sync.

GitHub Jira automation ends manual triage: issues sync to tickets in seconds, CI failures route to the right owner, and duplicates are suppressed by default.

CI failures that open their own Linear issue. PRs that assign themselves. Deploys that auto-close incidents. Five GitHub-to-Linear patterns that save time.

GitLab CI pipelines fail silently — no ticket, no assignment, no tracking. By the time someone notices, it's been 2 hours and the context is gone.

A flaky test detector finds unreliable tests by analyzing CI history for alternating pass/fail patterns. Here's how to build one and keep CI reliable.

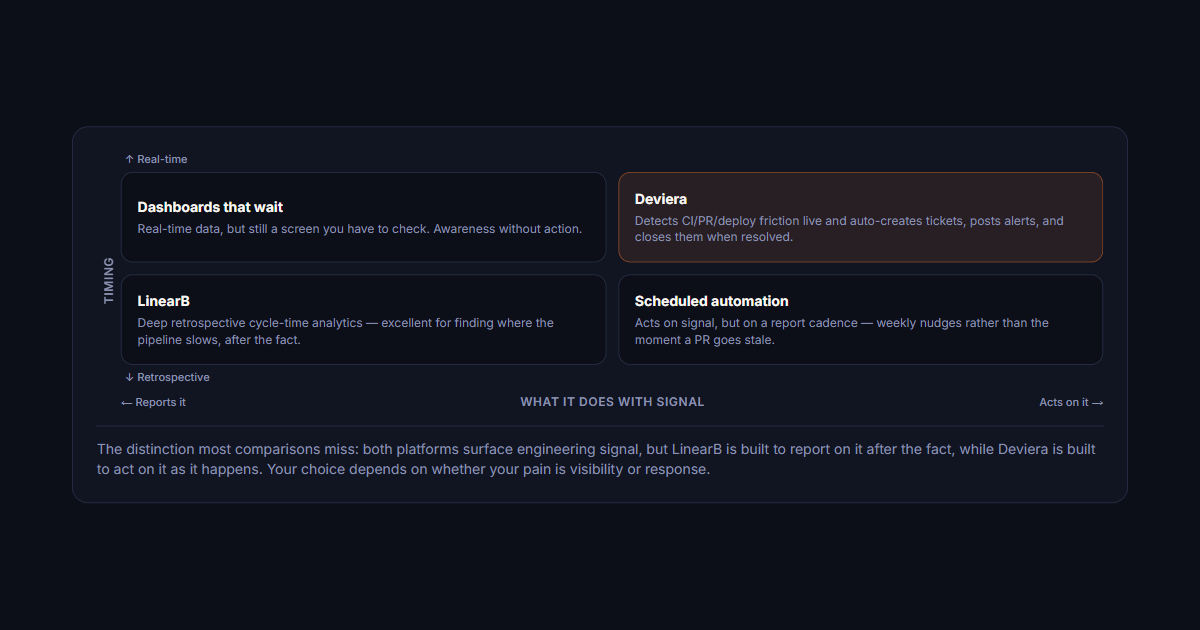
LinearB excels at cycle time analytics. Deviera's strength is automation depth and proactive friction detection. Here's how to choose between them.

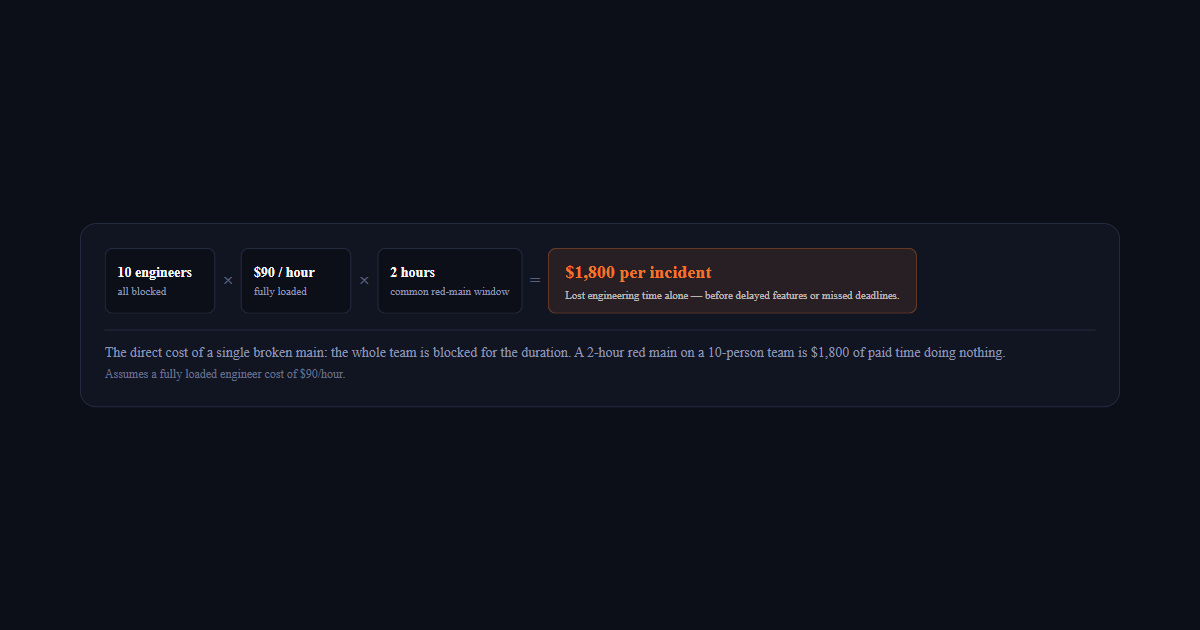
Every minute main branch CI is red, engineers risk merging on a broken build. Most teams have no recovery playbook — just a Slack channel and crossed fingers.

A 10-person team losing 35 min/developer/week to merge conflicts burns 7 engineer-weeks per year. Merge conflicts are a workflow problem, not a Git problem.

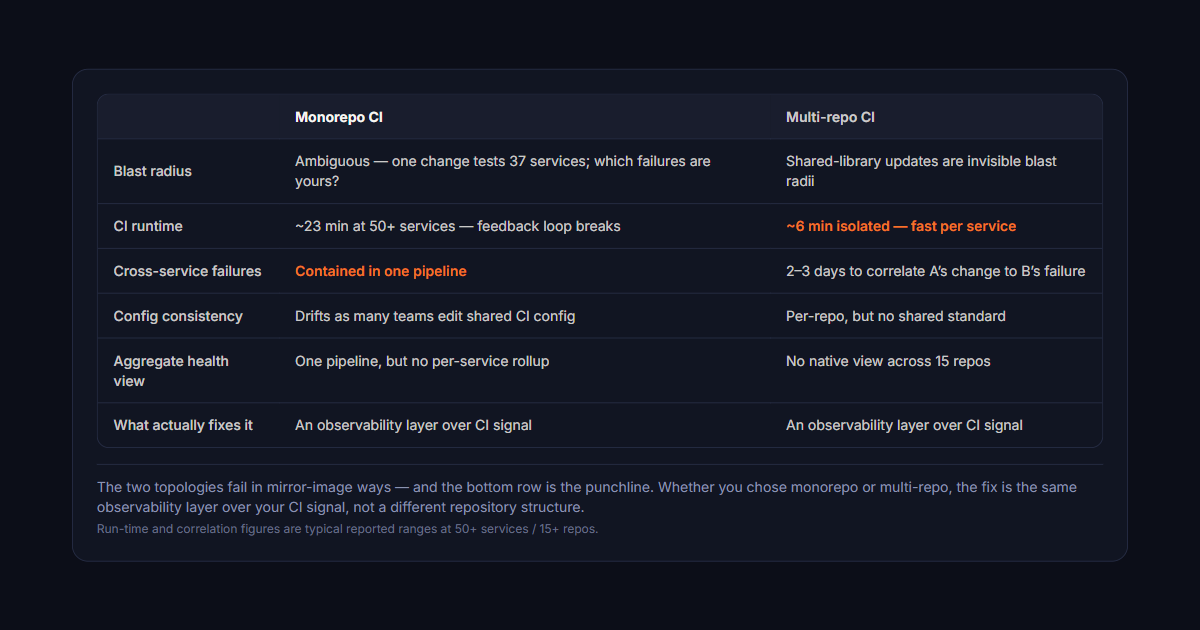
Monorepos average 23-minute CI runs; multi-repo teams spend 4× longer correlating cross-service failures. Topology matters less than the observability layer.

New hires average 18 days to their first meaningful PR while seniors lose 8–12 hours a week. Here's how to halve that onboarding timeline with automation.

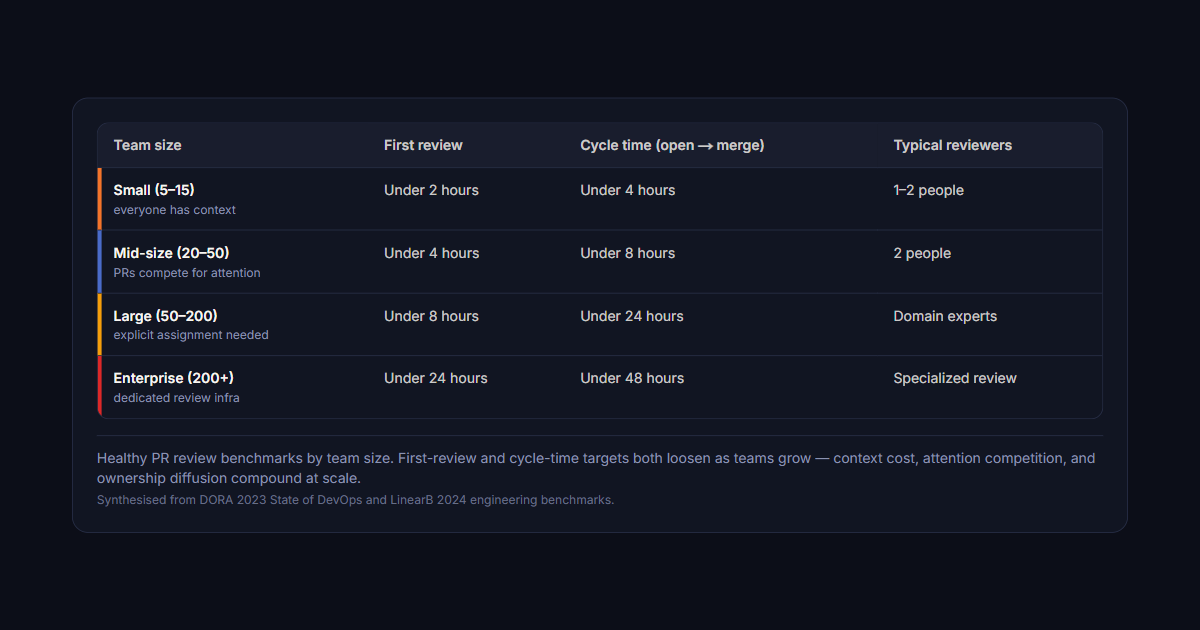
Small teams review PRs in under 2 hours; enterprise under 24. Healthy pull request lifecycle time benchmarks at 10, 50, and 500 engineers — and what yours mean.

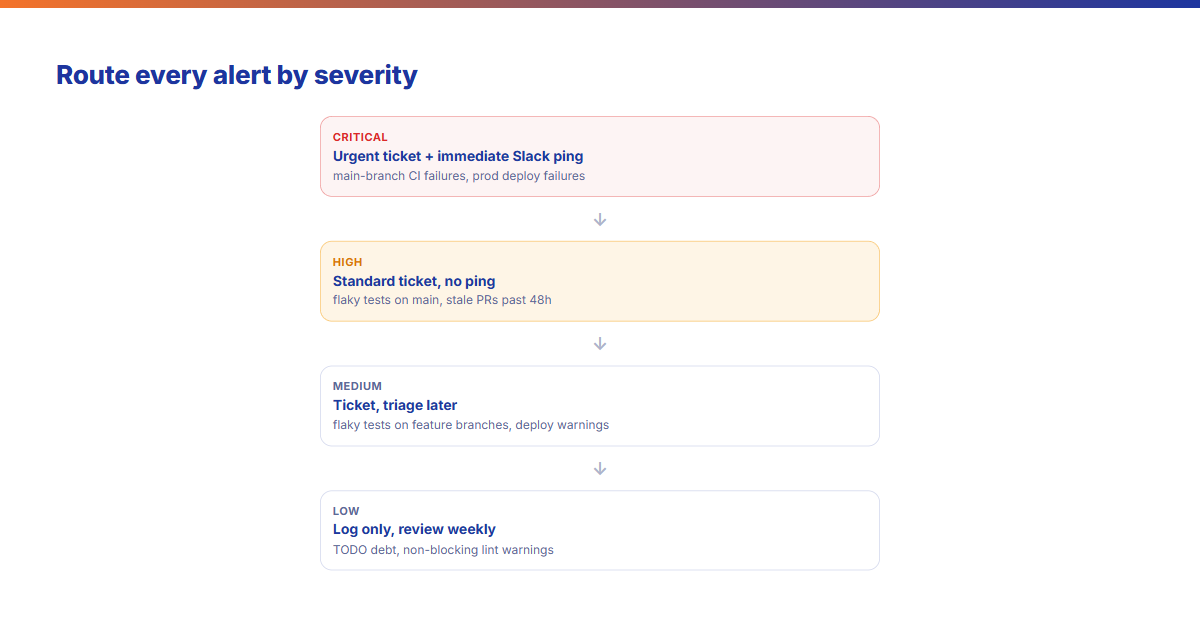
When everything pings, nothing gets fixed. Teams get 300+ automated notifications a week and respond to fewer than 30%. Here's how to filter the noise.

You do not get a second DevOps hire. Workflow automation — not task automation — is how lean teams scale CI and observability without adding headcount.

The first engineering process crisis hits ~8 months after Series A, almost always at 15–18 engineers. Here's what breaks at each scale transition.

Most teams have 4–7 Slack alert channels, yet fewer than 20% of notifications get a response within 2 hours. The rest just train your team to ignore them.

Tracking CI failures, incidents, and review bottlenecks as sprint overhead improves estimate accuracy by 40% within 3 sprints. The problem isn't story points.

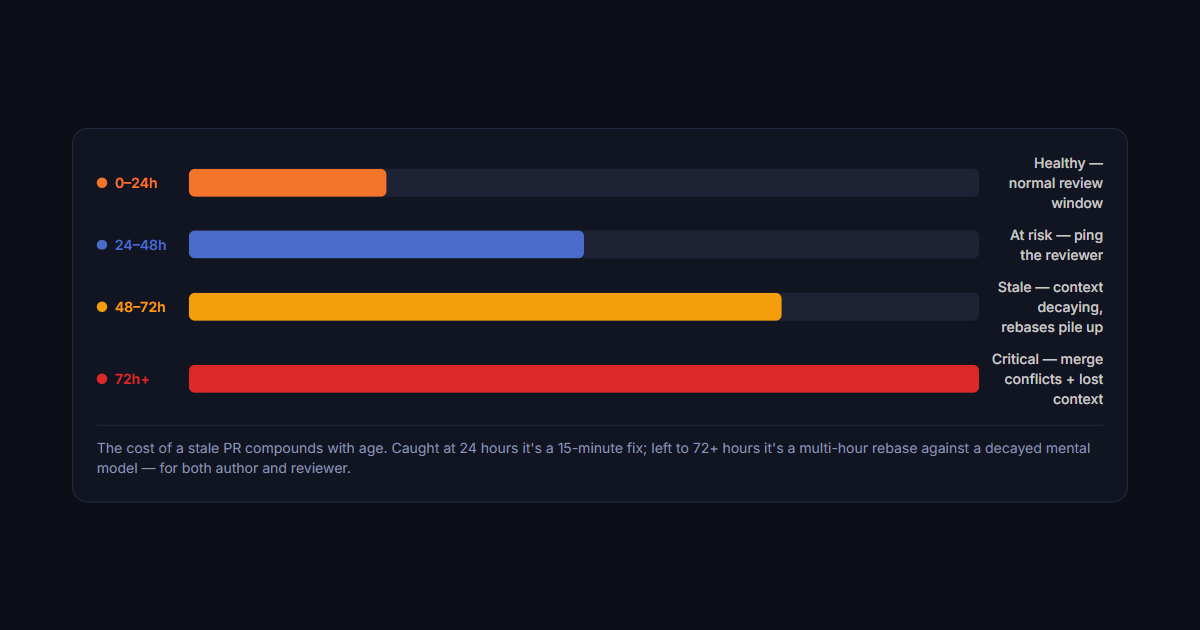
A PR that sits for 3 days costs far more than 3 days. Context decays, conflicts accumulate, velocity stalls. A data-driven look at how to catch it early.

TODO comments feel like a plan. They're debt you forgot you owed. Most teams have hundreds in production — and zero of them tracked in their issue tracker.

Vercel's monitoring is deployment-scoped, not team-scoped. No single pane links a broken branch to the PR, the engineer, and the failure pattern.

CI failures, stale PRs, flaky tests, deployment gaps — they're measurable drains on engineering velocity. Here's how to quantify friction and act on it.