LinearB vs. Deviera: Engineering Intelligence Compared
May 2, 2026·13 min read·by Ihab Hamdy
Both LinearB and Deviera are engineering intelligence platforms. Both connect
to GitHub, analyze engineering activity, and surface metrics to engineering
leaders. The distinction that matters — and that most comparison articles
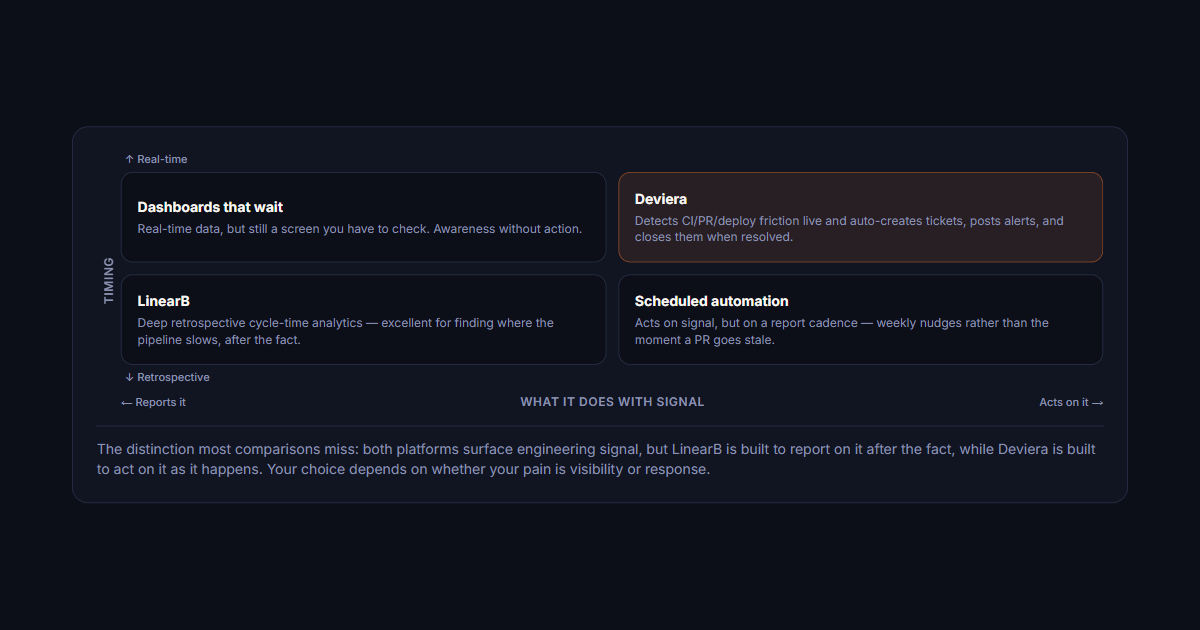
miss — is the difference between retrospective reporting and proactive automation.
One is a better rearview mirror. The other is a better early warning system.
Which one your team needs depends on your specific pain.
Timing
↑ Real-time
Dashboards that wait
Real-time data, but still a screen you have to check. Awareness without action.
Deviera
Detects CI/PR/deploy friction live and auto-creates tickets, posts alerts, and closes them when resolved.
LinearB
Deep retrospective cycle-time analytics — excellent for finding where the pipeline slows, after the fact.
Scheduled automation
Acts on signal, but on a report cadence — weekly nudges rather than the moment a PR goes stale.
↓ Retrospective
← Reports itWhat it does with signalActs on it →
The distinction most comparisons miss: both platforms surface engineering signal, but LinearB is built to report on it after the fact, while Deviera is built to act on it as it happens. Your choice depends on whether your pain is visibility or response.
What both platforms agree on: the core engineering intelligence value proposition
LinearB and Deviera were both built from the same starting observation:
engineering leaders are flying blind. They have GitHub, Jira, Slack, and
CI tools producing enormous amounts of signal — but no unified view that
converts that signal into engineering health clarity.
Both platforms address this by:
Connecting to GitHub (and other source control) to pull in PR, commit, and CI data
Surfacing velocity metrics — deployment frequency, PR cycle time, review time
Providing engineering managers with a view of team health that doesn't require attending every standup
Integrating with issue trackers (Linear, Jira) to correlate development activity with planned work
If you need any of these capabilities, both platforms are legitimate options.
The choice comes down to how you need to use that information — and how much
of it you want to automate.
Where LinearB excels: deep cycle time analytics and Git insights
LinearB's strongest product area is cycle time analysis. The platform provides
detailed breakdowns of how long code spends in each stage of the development
lifecycle: coding time, pickup time (time from last commit to first review),
review time, merge time, and deploy time.
For teams that want to answer the question "where in our pipeline is work slowing
down?" LinearB's granular cycle time breakdown is excellent. You can identify
whether bottlenecks are in the review stage, the pickup stage, or the deploy
stage — and drill down to individual contributors or teams to understand patterns.
LinearB's other notable strengths:
Git metrics depth. LinearB surfaces a rich set of Git-derived
metrics: coding days, PR size distribution, review participation rates.
For engineering leaders who want deep analytics on how the team is working
at the code level, LinearB's data model is comprehensive.
Sprint retrospective support. LinearB's reporting is well-suited
for sprint retrospectives — looking back at the previous sprint and understanding
where time went. The historical data is detailed and the visualizations are
well-designed for this use case.
Developer experience focus. LinearB has invested significantly
in the individual developer experience — surfacing personal metrics in a way
that's intended to feel empowering rather than surveillance-like. Developers
can see their own cycle time trends without feeling measured against a quota.
Recommended for you
Try the automation depth yourself
See where Deviera goes beyond dashboards — connect GitHub free and watch it turn stale PRs, CI failures, and deploy issues into tickets automatically.
Where Deviera excels: automation depth, signal aggregation, and proactive friction detection
Deviera's core architectural difference from LinearB is what happens after
a signal is detected. LinearB surfaces the signal in a dashboard.
Deviera routes it to a structured ticket, sends the right notification to the
right person, and auto-resolves when the underlying condition clears.
The distinction: LinearB tells you what happened. Deviera acts on it.
Deviera's primary advantages:
Automation Engine with 107 pre-built templates.
Deviera's Automation Engine supports 32 trigger types and 24 action types —
creating the ability to build automation workflows like "when main branch CI
fails, create a structured Jira ticket with the CI run, commit, and responsible
engineer, and send a Slack notification to #on-call." These workflows run
without human intervention. LinearB doesn't have an equivalent automation layer.
Cross-provider signal aggregation.
Deviera's Signal Feed aggregates events from GitHub, Linear, Jira, ClickUp,
GitLab, Vercel, and Slack into a single unified view. An engineering manager
doesn't need to check six dashboards to understand team health — one feed
surfaces everything that needs attention, ranked by severity.
Proactive detection, not retrospective reporting.
Deviera's Stale PR Scanner, CI Intelligence, and Friction Score are all
forward-looking: they identify conditions that will cause problems before
they cause them. A rising Friction Score is a warning, not a post-mortem.
A stale PR alert fires at 3 days open, not after the sprint miss.
Auto-resolution tracking.
When a CI failure that created a ticket is resolved, Deviera closes the ticket
automatically. This keeps the issue tracker clean and gives the team a
cycle-complete signal — not just an open backlog of stale failure tickets.
Head-to-head: integrations, automation templates, and pricing
Key comparison dimensions for teams evaluating both:
Integrations: LinearB connects primarily to GitHub/GitLab +
Jira/Linear for its analytics layer. Deviera integrates GitHub, Linear, Jira,
ClickUp, GitLab, Vercel, and Slack — with each integration feeding both the
Signal Feed and the Automation Engine, not just a metrics dashboard.
Automation: LinearB does not have a native automation engine
for creating tickets or routing notifications. Deviera has 107 pre-built
automation templates across 32 trigger types and 24 action types. If automation
is a core requirement, Deviera has a structural advantage.
Metrics depth: LinearB has deeper cycle time analytics with
more granular sub-stage breakdowns. Deviera covers the key metrics (deployment
frequency, PR cycle time, CI pass rate, Friction Score) with sufficient depth
for most EM use cases, but without LinearB's level of Git analytics detail.
Pricing: Deviera's Pro plan starts at $29/month for a single
workspace. LinearB's pricing is typically higher and structured per-seat.
For small teams (under 10 engineers), Deviera is significantly more cost-effective.
At larger team sizes (30+), compare per-seat economics directly.
How to choose: a decision framework by team size and pain profile
The right choice depends on what your team is most trying to solve:
Choose LinearB if:
Your primary pain is understanding where in the development cycle work slows down, with granular sub-stage visibility
You want deep developer experience metrics that can be shared with individual contributors
Your team is large (50+ engineers) and sprint retrospective reporting is a core use case
You want analytics-first tooling with manual action on the insights
Choose Deviera if:
Your primary pain is CI failures, stale PRs, and deployment issues that nobody is routing into structured tickets automatically
Your team is spending hours per week manually creating tickets from GitHub events, CI failures, or deployment issues
You want a unified Signal Feed that replaces dashboard switching across GitHub, Jira, Linear, Vercel, and Slack
You want the system to act on signals, not just show them — auto-creating tickets, routing alerts, and closing issues when conditions clear
Your team is 5–30 engineers and you need strong value-to-cost ratio
The teams that get the most from Deviera are the ones where engineers are
currently doing manual work that should be automated: opening Jira tickets
from CI failure emails, copying GitHub issue links into Slack, or checking
five dashboards every morning to understand team health. Deviera is the
automation layer for that manual work.
The teams that get the most from LinearB are the ones where the primary need
is analytical: understanding historical velocity patterns, drilling into
cycle time stages, and producing detailed reports for engineering leadership
on where time is going in the development process.
Both are legitimate tools. Most teams don't need both — and the decision
is cleaner than it looks once you map it to your actual pain.
Feature comparison table
A side-by-side reference for the dimensions that matter most in an evaluation:
PR cycle time analytics: LinearB (granular sub-stage breakdown) vs. Deviera (live PR Cycle Time dashboard — median and P75 cycle time benchmarked against elite, high, medium, and low tiers, computed from real GitHub events)
Deployment frequency tracking: Both — LinearB via Git tag analysis, Deviera via Vercel + GitHub Deployments API
CI pass rate monitoring: Deviera (real-time, with auto-ticketing on failure) vs. LinearB (limited, no auto-action)
Flaky test detection: Deviera (CI Intelligence) vs. LinearB (not available)
Slack integration: Deviera (alert routing with severity tiers) vs. LinearB (basic notifications)
GitLab support: Deviera (full OAuth + webhook) vs. LinearB (limited)
Pricing entry point: Deviera ($29/mo per workspace) vs. LinearB (per-seat, higher floor)
Free trial: Both (Deviera: 14-day, no CC required)
For a deeper feature-by-feature breakdown including integration scope and automation
template catalog, see the full
LinearB vs. Deviera comparison page.
Frequently asked questions
Is LinearB better than Deviera?
It depends on your primary use case. LinearB is better for teams whose main need
is retrospective cycle time analytics — understanding where in the development
lifecycle work is slowing down, with granular sub-stage breakdowns (coding time,
pickup time, review time, merge time). Deviera is better for teams whose main need
is proactive detection and automated action — turning CI failures, stale PRs, and
deployment issues into structured tickets automatically, without manual triage.
The two tools have minimal overlap in their core strengths; choosing between them
is less about quality and more about which problem you're solving.
Does LinearB have an automation engine?
No. As of 2026, LinearB does not have a native automation engine for creating tickets,
routing Slack alerts, or taking action on detected signals. It surfaces metrics and
insights in dashboards — what you do with those insights is manual. Deviera's
Automation Engine supports 32 trigger types and 24 action types, with 107 pre-built
templates covering the most common CI, PR, deployment, and issue-routing workflows.
If automating the response to engineering signals is a core requirement, Deviera
has a structural advantage.
Can I use LinearB and Deviera together?
In principle, yes — they cover different layers. LinearB for retrospective Git
analytics and cycle time reporting; Deviera for real-time signal detection,
automation, and the Friction Score. In practice, most teams find that one platform
covers enough of both needs that running both is hard to justify on cost. Teams
that use both tend to be larger organizations (50+ engineers) where the EM team
has a dedicated analytics reporting need alongside the operational automation need.
For most teams under 30 engineers, pick the one that addresses your primary pain
and revisit in 12 months.
What integrations does Deviera support that LinearB doesn't?
Deviera integrates with Vercel (deployment monitoring via API polling), ClickUp
(task creation and auto-resolution), GitLab (full OAuth + webhook pipeline/MR/push
events), and Slack (severity-routed alert messages). LinearB's integration layer
is primarily GitHub/GitLab for source data and Jira/Linear for project management
correlation — it does not have Vercel deployment tracking, ClickUp integration,
or a configurable Slack automation layer.