
Getting budget approved for engineering tools is harder than building the tools themselves.
CFOs want numbers, not stories. This guide gives you a framework to calculate the real cost
of engineering friction — and present a budget case that gets approved.
The budget conversation you're losing
You've been there. You walk into a budget meeting with a compelling case: "Our CI pipeline is
broken, our PR review times are through the roof, and we need tooling to fix it." The CFO
nods politely and asks: "What's the cost of not fixing it?"
You stumble. You say something about "engineering happiness" or "developer experience."
The CFO smiles and says let's table this. Six months later, your team is still losing
5 hours per week to manual triage, and you've lost two senior engineers who didn't want
to wait anymore.
The problem isn't that your case is wrong. It's that you're speaking a different language.
CFOs speak the language of numbers, risk, and opportunity cost. You need to meet them there.
Step 1: Measure the hidden cost of friction
Before you can build a budget case, you need data. The average engineering team loses
4-7 hours per week per engineer to recoverable overhead:
- CI triage — investigating failures, re-running tests, chasing down flaky tests
- PR coordination — nudging reviewers, re-requesting reviews, resolving merge conflicts
- Manual routing — copying GitHub issues to Jira, updating status across tools
- Deployment debugging — investigating failed deploys, rolling back, diagnosing
- Dashboard switching — checking GitHub, CI, Jira, Slack, Vercel, and monitoring separately to understand a single incident
That last item is frequently overlooked. Research on attention residue shows that each
context switch between tools costs ~23 seconds of re-orientation time. Engineers switch
between dashboards ~40 times per day — that's 15+ minutes of pure switching
overhead daily, or 60+ hours per engineer per year, before a single problem
is addressed. For a 10-person team: 600+ hours/year. At $90/hour loaded cost,
that's $54,000/year lost to tab management alone — a line item most
budget proposals never include.
Here's a quick audit you can run with your team: ask each engineer to track
"non-coding time" for one week. Use a simple spreadsheet with three columns:
activity, duration, and was it preventable? Most teams are shocked by the total.
Step 2: Calculate the real dollar impact
Once you have hours lost per week, converting to dollars is straightforward:
- Take your team's fully loaded cost (salary + benefits + overhead)
- Divide by ~2000 working hours per year to get hourly cost
- Multiply by hours lost per week × 52 weeks
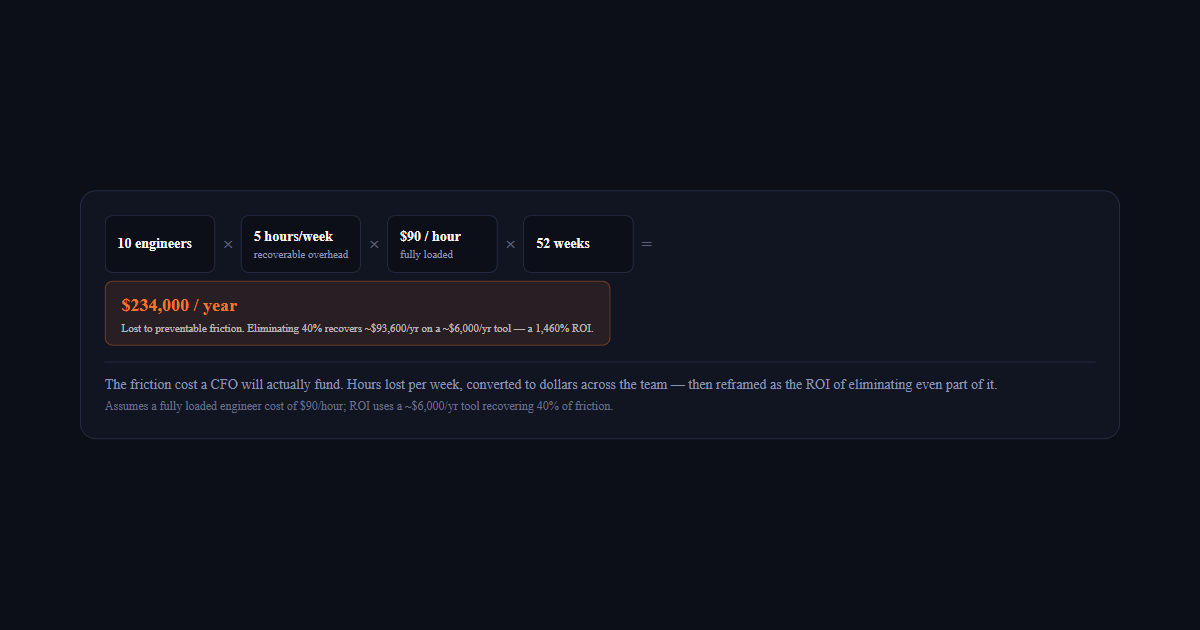
For a 10-person team at $90/hour loaded cost, losing 5 hours per week per engineer
translates to $234,000 per year in lost productivity. That's not a
tooling budget request — that's a profit and loss conversation.
10 engineers
5 hours/weekrecoverable overhead
$90 / hourfully loaded
52 weeks
$234,000 / yearLost to preventable friction. Eliminating 40% recovers ~$93,600/yr on a ~$6,000/yr tool — a 1,460% ROI.
Step 3: Frame the investment, not the cost
Here's the mental shift that changes the conversation: you're not asking for a budget
increase. You're proposing an investment with a quantifiable return.
The average engineering intelligence tool costs $500/month for a 10-person team.
If it eliminates even 40% of the friction you measured above, you're looking at:
- Investment: $6,000/year
- Return: $93,600 in recovered engineering time
- ROI: 1,460%
Put that in a spreadsheet and watch the CFO's posture change.
Step 4: Build the budget request document
Structure your proposal like this:
- Executive summary: One sentence. "We lose $X/year to preventable engineering friction; this tool recovers $Y for $Z/year."
- The data: Hours lost per week, converted to dollars. Include a table.
- The alternative: What happens if you do nothing? Include attrition risk.
- The investment: Tool cost, implementation time, training cost.
- The return: Conservative estimate (e.g., "we expect to recover 30-50%").
- Approval timeline: "If approved by May 1, we can start seeing returns by Q3."
What CFOs actually care about
After you've built your case, remember these three things CFOs always look for:
- Quantified risk: Show them what could go wrong if you don't act (attrition, missed deadlines, quality issues)
- Reversibility: If this doesn't work, can you cancel? Annual contracts with 30-day notice are safer bets.
- Benchmark comparison: "Company X used this exact approach and saw Y% improvement" carries weight.
The conversation starter
Next time you're in a budget meeting, don't lead with "we need better tooling."
Lead with: "I've done a cost analysis on our engineering friction, and I have
a proposal that pays for itself in 6 weeks."
That's the conversation that gets you to yes. Deviera's
Value Dashboard
tracks hours saved, automations fired, and issues auto-created in real time —
giving you live ROI data to back the budget case, not just a one-time estimate.
For the friction baseline, the free
CI Health Score Calculator
gives you a scored starting point in under 2 minutes.