DORA MetricsEngineering StrategyEngineering velocity
Deployment Frequency vs. Quality: The Trade-Off
May 2, 2026·7 min read·by Ihab Hamdy
The push toward higher deployment frequency was the right call. Ship smaller,
ship more often, reduce batch size — the research is clear. But somewhere along
the way, teams started optimizing the metric instead of the outcome. Deployment
frequency went up. Change failure rate went up too. And no one had the unified
view to see that the two were moving in opposite directions.
The frequency trap
DORA's 2023 State of DevOps Report identifies deployment frequency as one of
four key accelerators of software delivery performance. Elite teams deploy multiple
times per day. That finding is real and reproducible.
What the report also shows — and what gets less attention in the engineering
blogosphere — is that elite performers maintain a change failure rate
under 5%. They ship fast and they ship reliably. Frequency without
reliability isn't elite performance; it's just fast failure.
The teams that fall into the frequency trap look like this:
Moved from biweekly deployments to daily deployments over 6 months
Celebrated the velocity improvement at the all-hands
Saw production incidents increase from 1–2 per month to 5–8 per month
Spent 40% more engineering time on incident response than the prior quarter
Had no single metric that showed the trade-off they were making
More deployments created more opportunities for failure. Without a corresponding
investment in CI signal quality, test coverage, and deployment quality gates,
the frequency gain was partially offset by the reliability loss. The problem is
that deployment frequency is easy to measure and change failure rate is often
invisible until production is on fire.
DORA Metrics Calculator
Are you trading quality for frequency?
Enter your deployment frequency and change failure rate together to see your DORA tier — and whether you're shipping faster at the cost of stability.
How to read change failure rate as a leading indicator
Change failure rate is traditionally measured as a lagging indicator: what
percentage of deployments caused an incident or required a rollback, measured
after the fact. By the time you calculate last quarter's change failure rate,
the production incidents have already happened.
The teams that manage this well use a set of predictive signals that
correlate with future change failure rate — signals you can act on before
deployment, not after:
CI pass rate trend. A declining CI pass rate over the last
5–10 deployments is a leading indicator that test quality is degrading. Teams
that ignore a CI pass rate dropping from 94% to 88% over two weeks reliably
see a change failure rate spike in the subsequent month.
Flaky test rate. Flaky tests suppress CI signal reliability.
When engineers learn that CI failures are "probably just flaky," they start
merging on red. That behavior is invisible in deployment frequency metrics
but shows up directly in change failure rate.
PR review time compression. When deployment pace increases
without a corresponding increase in review capacity, PR review time drops.
PRs reviewed in under 30 minutes by a single reviewer have a higher post-deploy
defect rate than PRs reviewed over 2+ hours by two reviewers. Speed pressure
on the review queue is a quality predictor.
Hotfix frequency. How often in the last 30 days did you deploy
a hotfix — a commit that exists specifically to patch something broken in a
previous deploy? One hotfix per month is normal. Five is a signal that your
deployment quality gate is not filtering enough.
Four signals that predict a quality regression before it hits production
The most effective deployment quality monitoring is pre-deployment, not
post-incident. Here's the hierarchy of signals that correlate most strongly
with upcoming quality regressions:
1. CI pass rate on main below 90%. If your main branch is
failing CI more than 10% of the time, the team has normalized broken main.
Deploys from a broken main are unpredictable. This is a hard threshold —
not a trend to watch but a condition to act on immediately.
2. PR cycle time below 4 hours with no corresponding test coverage increase.
Fast cycle times are healthy when test coverage scales proportionally.
Fast cycle times with flat or declining coverage means the team is going
faster with less verification. That's a quality regression in slow motion.
3. Deployment frequency acceleration without pipeline coverage expansion.
Doubling deployment frequency should roughly double the number of code paths
exercised per CI run. If frequency doubled but pipeline configuration stayed
constant, each deploy is less-tested than it was before.
4. Week-over-week increase in P1 alert volume from production.
Not all P1 alerts indicate a quality regression — but a trend over 3+ weeks
is hard to dismiss as noise. P1 alert volume is the canary for change failure
rate before the rate itself is calculable.
Building a deployment quality gate without slowing your pipeline
The standard response to quality regression is to add blocking gates to CI:
mandatory test coverage minimums, required approval counts, deploy freeze windows.
These slow the pipeline. Teams that experienced the speed gains from high
deployment frequency resist them viscerally — and they're right to be skeptical
of gates that add friction without adding signal.
The alternative: non-blocking signals with automatic escalation.
Track CI pass rate per commit author over 30 days. Not to
blame individuals — to identify which areas of the codebase have degrading
test quality before they become deployment failures.
Set a flaky test count threshold. When active flaky test
count exceeds N, auto-create a team-level ticket to address the backlog.
Flaky tests are not individual problems — they're a team quality signal.
Surface the frequency/failure rate ratio weekly. An Engineering
Manager who sees "deployment frequency +12%, change failure rate +8%" in their
weekly health report can ask the right question before the next production incident.
Require hotfix PRs to be tagged. Every hotfix creates a data
point. A tagging requirement (even just a PR label) makes hotfix frequency
trackable without adding process friction to normal deployments.
The right ratio: how elite teams balance frequency and stability
DORA's elite performers don't trade frequency for stability or stability for
frequency. They achieve both by treating CI quality as infrastructure, not
as a project.
The benchmarks for a team operating in the elite band:
Deployment frequency: Multiple deploys per day (or at minimum, daily)
Change failure rate: <5% of deploys require rollback or hotfix
Mean time to restore: <1 hour when a failure does occur
CI pass rate on main: >95% rolling 30-day average
Flaky test count: <5 known flaky tests in the active suite
If your team is hitting the frequency benchmarks but not the stability benchmarks,
you're in the high-frequency / high-failure-rate quadrant. The path out is not to
slow down — it's to invest in CI signal quality until the stability benchmarks
catch up with the frequency gains.
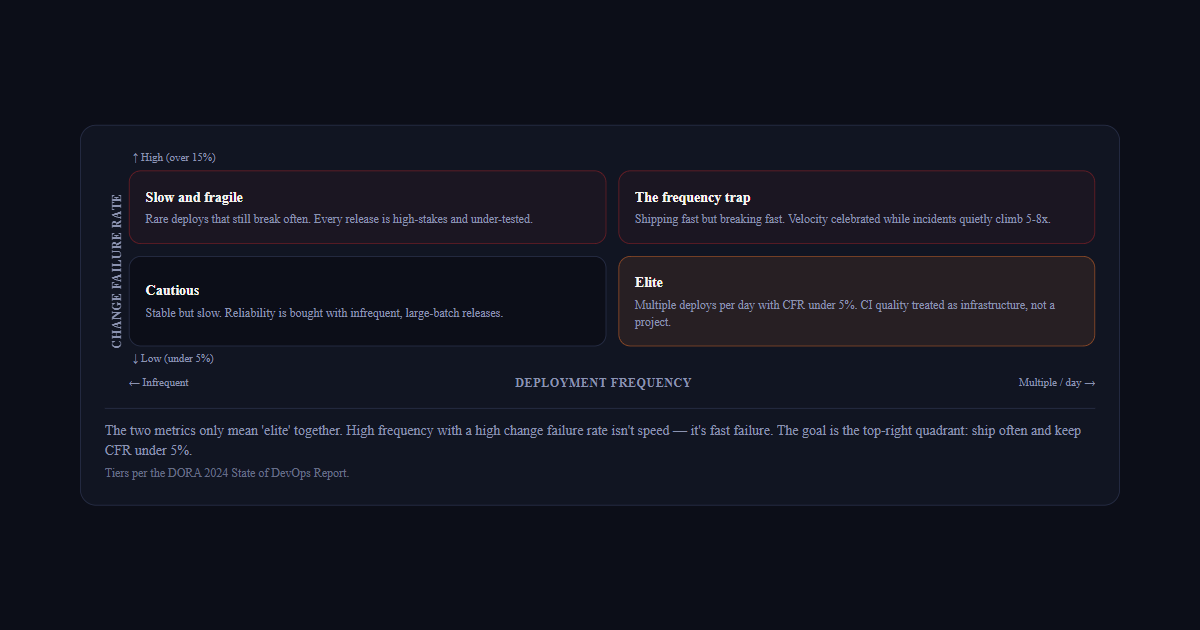
Change failure rate
↑ High (over 15%)
Slow and fragile
Rare deploys that still break often. Every release is high-stakes and under-tested.
The frequency trap
Shipping fast but breaking fast. Velocity celebrated while incidents quietly climb 5-8x.
Cautious
Stable but slow. Reliability is bought with infrequent, large-batch releases.
Elite
Multiple deploys per day with CFR under 5%. CI quality treated as infrastructure, not a project.
↓ Low (under 5%)
← InfrequentDeployment frequencyMultiple / day →
The two metrics only mean 'elite' together. High frequency with a high change failure rate isn't speed — it's fast failure. The goal is the top-right quadrant: ship often and keep CFR under 5%.Tiers per the DORA 2024 State of DevOps Report.
The teams that get this right have one thing in common: they measure both metrics
weekly, together, in a format that makes the trade-off visible. Not deployment
frequency in one dashboard and change failure rate in another — both on the same
weekly report, with the ratio tracked as a first-class metric.
The teams that get this right measure both metrics together, in a shared weekly report, with the
ratio tracked as a first-class metric — which is exactly what an
engineering intelligence platform
is for. Deviera's
DORA Metrics Calculator
lets you benchmark your four DORA metrics instantly — no signup required. If you connect GitHub,
the
live DORA Metrics dashboard
computes deployment frequency, lead time, and change failure rate automatically from your real
integration data, updated in real time.
Frequently asked questions
What is deployment frequency?
Deployment frequency is how often a team ships changes to production. It is one of the four DORA keys of software delivery performance — elite teams deploy multiple times per day, and the research shows smaller, more frequent deploys are a real, reproducible accelerator. The catch is that frequency only signals elite performance when it's paired with a low change failure rate; shipping fast while breaking often isn't speed, it's fast failure.
How is deployment frequency measured?
Deployment frequency is measured as the rate of deployments to production over a time window — for elite teams that's multiple deploys per day, for others daily, weekly, or less often. On its own the count is easy to track, which is part of the problem: it's far easier to measure than change failure rate, so teams optimize the visible number while reliability quietly slips. Track it alongside change failure rate so the trade-off stays visible — the frequency/failure-rate ratio is worth surfacing weekly as a first-class metric.
Is deployment frequency a good metric on its own?
No. Deployment frequency is necessary but not sufficient. Teams that chased frequency in isolation moved from biweekly to daily deploys, celebrated the velocity, and then watched production incidents climb from 1–2 per month to 5–8 — spending 40% more time on incident response — because they had no single view showing frequency and change failure rate moving in opposite directions. Elite performers hit both: multiple deploys per day with change failure rate under 5%, achieved by treating CI quality as infrastructure rather than trading one metric for the other.