
Your team isn't just slow because of CI failures or stale PRs. It's slow because your
engineers spend a chunk of every day switching between dashboards to find out what's
broken. GitHub, CI, Jira, Slack, Vercel, Linear — six tools, six tabs, six places to
check before you can understand what's happening. The math is worse than you think.
The 6 dashboards every engineer monitors
Ask any Platform or DevOps engineer how many dashboards they check daily and they'll
start counting on their fingers. The typical list:
- GitHub — PR reviews, CI results, open issues, deploy status
- CI tool (CircleCI, GitHub Actions, Jenkins) — pipeline runs, failure logs, test reports
- Issue tracker (Jira or Linear) — open tickets, sprint board, assigned work
- Slack — alert channels, PR pings, on-call mentions
- Deployment provider (Vercel, Railway, AWS) — deployment status, build logs
- Monitoring (Datadog, Sentry, Grafana) — error rates, uptime, performance
Six dashboards. And that's a conservative count — many teams add GitLab, ClickUp,
PagerDuty, or DataDog on top. Each one is a separate login, a separate mental model,
and a separate context to load every time you open it.
The switching tax: the math your team is ignoring
Context switching has a well-documented cost. Research on attention residue shows that
every time you switch between tasks or tools, your brain carries "residue" from the
previous context — partial focus, incomplete thoughts, re-orientation overhead. The
time cost per switch is approximately 23 seconds of re-orientation, plus the cognitive
load of maintaining multiple mental models simultaneously.
Here's what that means for a typical engineering day:
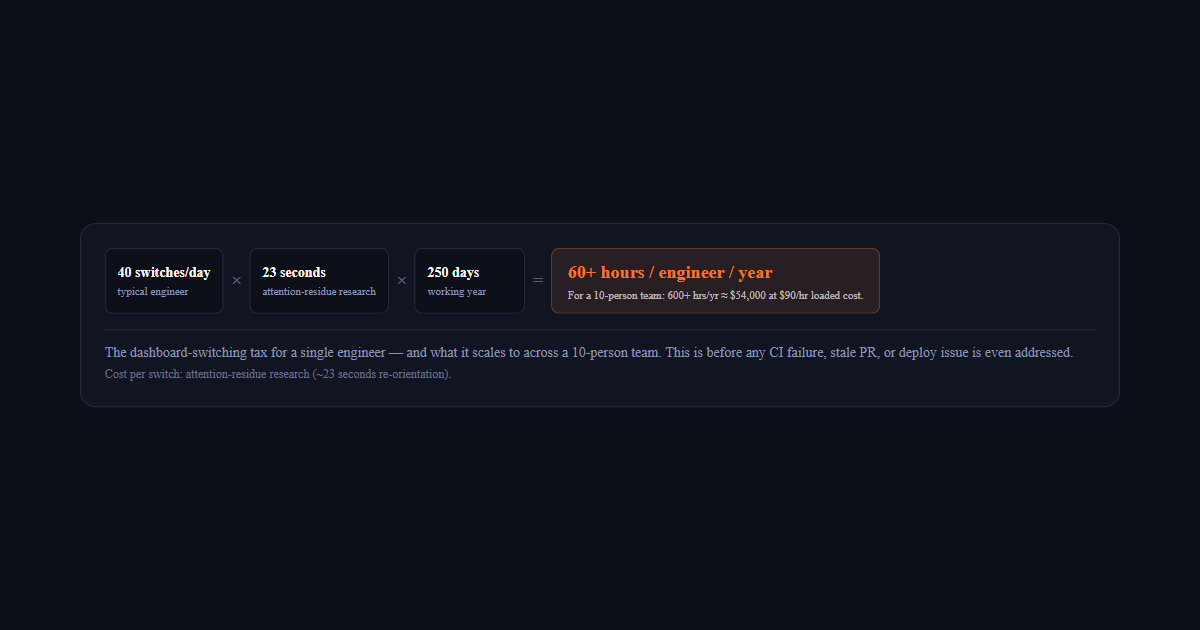
- Average engineer switches between dashboards ~40 times per day
- Each switch costs ~23 seconds in re-orientation time (attention residue research)
- 40 switches × 23 seconds = 15+ minutes lost daily
- 15 minutes/day × 250 working days = 60+ hours per engineer per year
40 switches/daytypical engineer
23 secondsattention-residue research
250 daysworking year
60+ hours / engineer / yearFor a 10-person team: 600+ hrs/yr ≈ $54,000 at $90/hr loaded cost.
For a 10-person engineering team, that's 600+ hours per year lost to
dashboard switching alone — before a single CI failure, stale PR, or deployment issue
is even addressed. At a loaded cost of $90/hour for a senior engineer, that's
$54,000 per year evaporating into tab management.
Why adding tools makes it worse, not better
The instinct when engineering teams feel friction is to add a tool. CI failing too
often? Add a test analytics dashboard. PRs taking too long? Add a code review tool.
Deployments opaque? Add a deployment tracker.
Each addition is rational in isolation. Each addition also adds another dashboard to
the daily rotation. After 18 months of this, engineers are checking 9 dashboards
instead of 6 — and the switching tax has grown by 50%.
This is the "dashboard proliferation" trap: more tooling, more context, more switching,
less shipping. The tools are individually useful, but together they create a coordination
overhead that compounds with team size.
The alternative: one signal feed, zero switching
The fix isn't better dashboards. It's fewer of them.
Engineering intelligence platforms like Deviera work by aggregating signal from all
your connected tools into a single unified feed — then acting on that signal
automatically. Instead of checking GitHub for CI failures, Linear for open tickets,
Slack for PR pings, and Vercel for deployment status, one Signal Feed shows you
everything that needs attention, ranked by severity, with deduplication across providers.
The loop Deviera closes: Detect → Create → Resolve → Measure.
- Detect — CI failure on main, stale PR, flaky test, failed deployment, stale TODO debt
- Create — structured ticket in Linear, Jira, ClickUp, or GitLab automatically
- Resolve — ticket auto-closes when the underlying condition clears
- Measure — Friction Score + weekly health report shows what improved
No other tool in this category closes the loop end-to-end. Waydev shows you metrics
but takes no action. Sentry monitors errors but doesn't create tickets or auto-resolve.
Linear and Jira track issues but don't detect them. Deviera does all four — from one screen.
What the Friction Score adds
Dashboard switching isn't the only hidden cost. Even after you see a problem,
the time to classify it, route it, and track it to resolution is overhead most
teams don't measure. Deviera's Friction Score (0–100) aggregates all active engineering
signals by severity into a single number — so an Engineering Manager can see
the team's overall friction at a glance instead of mentally summing 6 dashboards.
A rising Friction Score before a sprint predicts velocity degradation. A stable low
score means the team is shipping without material overhead. It's the metric you can
actually bring to a standup or a sprint review without opening six browser tabs first.
The persona that feels this most
Platform and DevOps engineers have it worst. A typical DevOps engineer responsible
for 20–50 repos monitors all 6 dashboards for all of them. Every CI failure on every
repo lands in their feed. Every deployment issue across every environment is theirs
to investigate. The 40-switch estimate for a product engineer becomes 80+ for a
DevOps engineer covering a broad surface area.
"You didn't join DevOps to be a dashboard tab-switcher."
Engineering Managers face a different version: they check GitHub for PR status,
Linear for sprint progress, Slack for blockers, and CI for pipeline health —
and still don't have a clear picture of what's blocking the team until someone
tells them in a meeting. The switching tax shows up as delayed awareness, not
just wasted time.
Closing your extra tabs
The goal isn't to have better dashboards. It's to need fewer of them. The teams
that ship fastest aren't the ones with the most monitoring — they're the ones
with the tightest signal loop: one place to see what's broken, one place to track
resolution, one metric to communicate team health upward.
If your team is checking 6 dashboards daily, you're paying the switching tax.
The question is whether you want to keep paying it.