
Daily dashboards are too noisy. Quarterly OKRs are too slow. A weekly engineering
health report gives you the right cadence to spot trends, catch problems early,
and make adjustments before they become crises.
The case for weekly
Here's why weekly is the sweet spot for engineering health reporting:
- Daily is too noisy: Single-day variations are rarely meaningful. A bad Tuesday doesn't mean there's a problem.
- Monthly is too slow: By the time you see a monthly trend, you've already lost weeks of opportunity to intervene.
- Quarterly is crisis mode: Quarterly reviews are for OKRs, not operations. You shouldn't be surprised by quarterly metrics.
Weekly gives you enough signal to see real trends without the noise of daily fluctuations.
What to include in your report
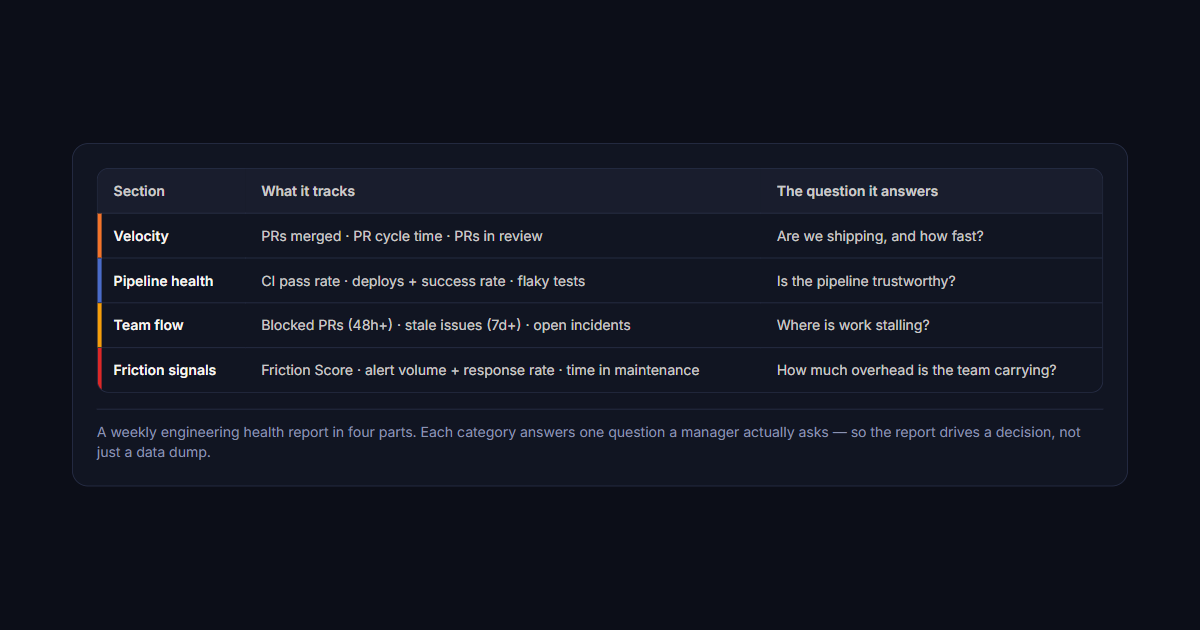
| Section | What it tracks | The question it answers |
|---|---|---|
| Velocity | PRs merged · PR cycle time · PRs in review | Are we shipping, and how fast? |
| Pipeline health | CI pass rate · deploys + success rate · flaky tests | Is the pipeline trustworthy? |
| Team flow | Blocked PRs (48h+) · stale issues (7d+) · open incidents | Where is work stalling? |
| Friction signals | Friction Score · alert volume + response rate · time in maintenance | How much overhead is the team carrying? |
Velocity metrics
- PRs merged: Total count, compared to last week
- PR cycle time: Average time from open to merge
- PRs in review: How many are waiting, how long have they been waiting
Pipeline health
- CI pass rate: Percentage of runs passing on first attempt
- Deploys: Count of production deploys, success rate
- Flaky tests: Any tests that failed 3+ times this week
Team flow
- Blocked PRs: PRs waiting on external review for 48+ hours
- Stale issues: GitHub issues with no activity in 7+ days
- Open incidents: Active incidents, time in current state
Friction signals
- Friction Score: Aggregated measure of active engineering friction
- Alert volume: Total alerts this week, response rate
- Time in maintenance: Hours spent on operational work vs. features
What to ignore
These metrics are tempting but not useful for weekly reporting:
- Code coverage: Too slow-moving to matter week-over-week
- Lines of code: Measures input, not output
- Story points: Estimates, not measurements
- Individual performance: Weekly reports are for team health, not evaluations
The structure of a good report
A weekly engineering health report should be one page, delivered Monday morning,
and contain:
- Headline: One sentence on overall team health ("Team is healthy" / "2 areas of concern")
- Key metrics: 5-7 numbers with week-over-week comparison
- Trends: 2-3 observations about what's getting better or worse
- Action items: Anything that needs attention this week
Keep it under 5 minutes to read. Nobody reads a 10-page engineering report.
Making it automatic
You shouldn't be manually assembling this report. Automate the data collection:
- Pull from GitHub API: PR counts, cycle times, review times
- Pull from CI: Pass rates, deploy counts, flaky tests
- Pull from issue tracker: Open issues, stale items, incident count
- Generate and email: Create a template, populate with data, send Monday morning
This takes about 2 hours to set up and then runs itself forever.
What to do with the report
A report is only useful if someone acts on it. Use the weekly report to:
- Start the week aligned: Spend 10 minutes in team sync reviewing the report
- Prioritize attention: If PR review time is up 40%, that's the priority this week
- Escalate patterns: If a trend continues for 3+ weeks, escalate to team lead
The goal isn't to create a report. The goal is to have a feedback loop that
keeps the team healthy. Deviera sends a
Weekly Engineering Health Report
every Monday automatically — pre-populated with your Friction Score, PR cycle time,
CI pass rate, and deploy frequency — so you're not assembling it by hand. See the
4 engineering velocity metrics
that should anchor every weekly report.