PR throughput is the number of pull requests your team merges in a given period, usually
counted per developer per month. On its own it is one of the easiest engineering metrics
to misread, because both a low number and a high number can signal a problem. This is
what healthy throughput looks like, why the top of the range is as much a warning as the
bottom, and the changes that actually move it. For the definition and how throughput
relates to pickup, review, and merge time, start with the
PR cycle time calculator,
which benchmarks both together.
What healthy PR throughput looks like
Across teams practising continuous review, healthy throughput lands between
8 and 25 merged pull requests per developer per month — call it two to
six a week. That is a deliberately wide band, because throughput is a function of how you
slice work rather than how hard people are working. A team doing trunk-based development
with tightly scoped PRs sits near the top; a team shipping larger feature branches sits
near the bottom and can be equally healthy.
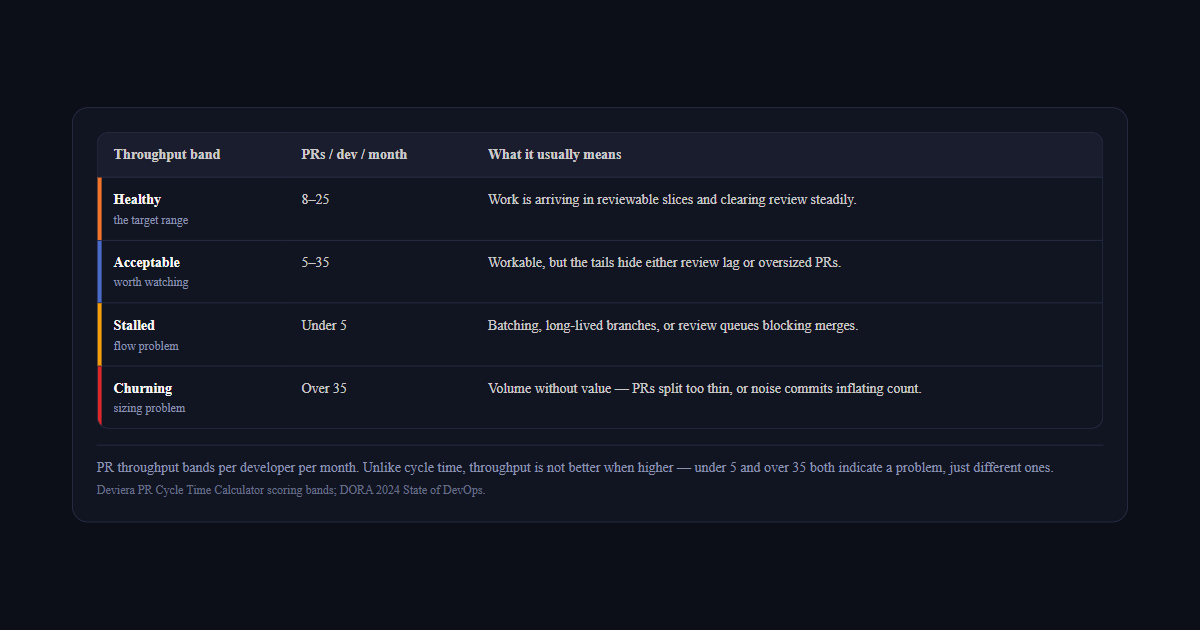
What makes throughput awkward as a metric is that it is not a maximise-me number. Both
tails are signals:
Throughput band
PRs / dev / month
What it usually means
Healthythe target range
8–25
Work is arriving in reviewable slices and clearing review steadily.
Acceptableworth watching
5–35
Workable, but the tails hide either review lag or oversized PRs.
Stalledflow problem
Under 5
Batching, long-lived branches, or review queues blocking merges.
Churningsizing problem
Over 35
Volume without value — PRs split too thin, or noise commits inflating count.
PR throughput bands per developer per month. Unlike cycle time, throughput is not better when higher — under 5 and over 35 both indicate a problem, just different ones.Deviera PR Cycle Time Calculator scoring bands; DORA 2024 State of DevOps.
Under five merged PRs per developer per month, work is not flowing. Above thirty-five,
the usual explanation is not a hyper-productive team but PRs that have been split past
the point of usefulness — or a count inflated by dependency bumps and formatting commits
that never needed review at all.
Why throughput without cycle time is a vanity metric
Throughput answers "how much did we merge?" It does not answer "how long did it take?" —
and the second question is where the improvable problems live. The two numbers only mean
something in combination:
High throughput, low cycle time: the healthy case. Work is arriving in reviewable slices and clearing review quickly.
High throughput, high cycle time: a review backlog. PRs are opening faster than reviewers can clear them, so volume looks strong while work-in-progress quietly climbs.
Low throughput, low cycle time: reviews are fast, but little is arriving. Usually upstream — unclear priorities, long-lived branches, or work batched into rare large drops.
Low throughput, high cycle time: the compounding case. Little is arriving and what does arrive waits. This is where teams feel slow without being able to point at a cause.
This is why reporting throughput alone tends to mislead leadership. A team can double its
merged-PR count by splitting the same work into twice as many pieces, and the chart will
look like a productivity win while cycle time and review load both get worse.
DORA Metrics Calculator
See your throughput and cycle time together
Throughput only means something next to cycle time. Enter both and see which phase of review is actually holding your team back.
When throughput sits below the healthy band, the cause is almost always one of these —
and only the last is about how much code people are writing:
Reviewer concentration. Two or three people are the de facto reviewers for everything. Throughput tracks their availability, not the team's output. This is the single most common cause and the easiest to miss.
Long-lived branches. Work accumulates for a week or more before becoming a PR. Throughput arrives in bursts, and each PR is large enough to be slow to review.
Slow or flaky CI. If the pipeline takes forty minutes and fails intermittently, every PR carries a re-run tax. Engineers respond by batching more work per PR, which lowers count and raises risk together.
No explicit review assignment. PRs opened to a team rather than a person wait for a volunteer. See why PRs go stale for how quickly that cost compounds.
Genuinely low input. Sometimes the team really is doing less coding — because of interviews, incidents, meetings, or planning overhead. Worth confirming, but check the four above first.
How to raise throughput without losing review depth
The interventions that work all reduce the cost of reviewing, rather than pressuring
people to merge more:
Cap PR size. Under roughly 400 lines is the standard threshold where review quality starts to drop. Smaller PRs review faster, and throughput rises as a side effect rather than as a target.
Assign a reviewer at creation. Named reviewers, or a round-robin rotation, remove the wait-for-a-volunteer gap that dominates pickup time on most teams.
Broaden the reviewer pool. If two people review everything, throughput has a hard ceiling set by their calendars. Spreading review across more of the team raises the ceiling directly.
Fix the flaky tests first. Re-runs are pure latency. Quarantining flaky tests often buys more throughput than any process change.
Alert on PRs that stall, not on PR count. A PR sitting unreviewed past your threshold is the actionable event. The count is just the aggregate that follows.
Track the pair, not the single number. Deviera watches PR throughput and cycle time
together across your repositories, flags PRs that stall past your threshold, and routes
them to Slack or as tickets before they turn into next week's dip in the chart. The
PR cycle time calculator
gives you both numbers against DORA tiers in about a minute, with no login.
Frequently asked questions
How many PRs per developer per week is normal?
Roughly two to six merged pull requests per developer per week, which works out to 8–25 per month. The range is wide because it depends on how your team slices work: a team doing trunk-based development with small, single-purpose PRs will sit at the top of it, while a team shipping larger feature branches will sit at the bottom and still be perfectly healthy. What matters more than the absolute number is whether it is stable. A throughput figure that swings by 50% week to week usually means work is arriving in unpredictable batches rather than a steady flow.
Does higher PR throughput mean lower code quality?
Not by itself. Throughput rises for two very different reasons, and only one of them is good. If it rises because PRs got smaller and review got faster, quality typically improves — smaller diffs get more careful review and produce fewer defects. If it rises because work is being split arbitrarily to hit a number, or because review has become a rubber stamp, quality falls. The way to tell them apart is to watch throughput alongside change failure rate: if throughput climbs while change failure rate holds steady or drops, the gain is real.
Should I set a PR throughput target for my team?
Not as an individual target. PR count is trivially gameable — an engineer told to merge more PRs can simply split the same work into more pieces, which adds review overhead without adding value. Throughput is useful as a team-level health signal you watch for changes, not as a per-person quota you manage to. If you want a target that drives the right behaviour, target PR size or first-review time instead; throughput tends to improve on its own as a consequence.
Why did our PR throughput drop without anything changing?
The most common cause is reviewer availability, not developer output. When one or two people carry most of the review load and they go on leave, into interviews, or onto an incident, merged-PR volume falls within a week even though the same amount of code is being written — it is simply sitting in the review queue. Check open-PRs-per-reviewer and first-review time before concluding that delivery has slowed. A second common cause is a batch of long-lived branches landing at once, which inflates one week and deflates the next.